Thermodynamic Database
Components (13)
A total of 13 components are included in the database as listed here:
Al-B-Co-Cu-Dy-Fe-Ga-Gd-Nb-Nd-O-Pr-Tb
Suggested Composition Range
The suggested composition range for each element is listed in Table 1. It should be noted that this composition range is based on the validation we performed on assessed systems. Some subsystems can be applied to the entire composition range as given in Table 3 and Table 4.
The stabilities and properties of the magnetic phase (Nd2Fe14B based T1 phase) are carefully assessed. It can be used to predict the phase equilibria, solidification, and magnetic properties, such as Curie temperature, saturation magnetization (Bs) and magnetocrystalline anisotropy field (HA) of the magnetic materials.
| Elements | Composition Range (wt.%) |
|---|---|
|
Co,Fe |
50 ~ 100 |
|
Al,Cu,Ga,Nb |
0 ~ 10 |
|
Dy,Gd,Nd,Pr,Tb |
0 ~ 40 |
|
B |
0-5 |
|
O |
0-10 |
Phases
A total of 141 phases are included in the current database. The names and thermodynamic models of some phases are given in Table 2. Information on all phases is listed in PanMag2024: List of Phases. Users can also view it through TDB viewer of Pandat™.
Key Elements and Subsystems
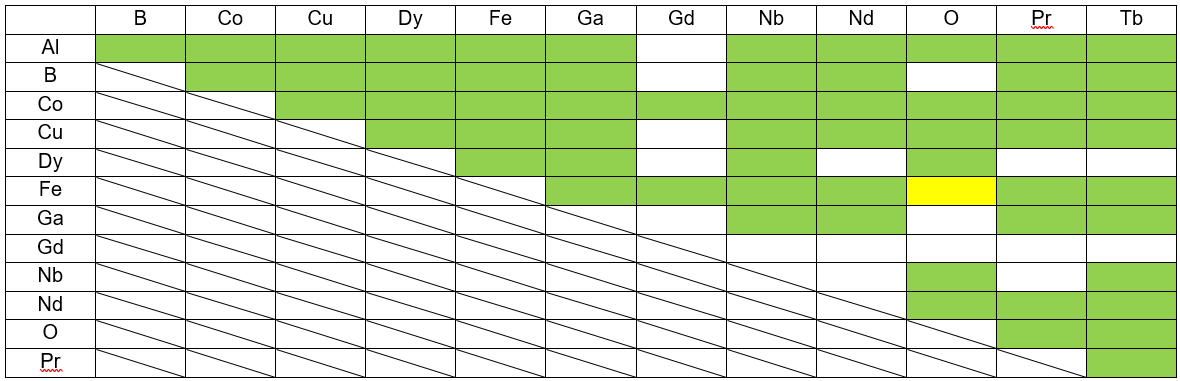
Table 3 lists major binaries and Table 4. lists the modeled ternaries in the 13-component system. Thermodynamic descriptions are fully developed for the systems in green color, which means that there is no composition limit if calculations are carried out for these systems. Only major phases are considered for the systems in yellow color. For these systems, phase relationships are correct in the areas near the major phases. In the ternary systems with light blue color, only partial descriptions for major phases are developed, which means the descriptions are good within low concentration of boron or carbon. No model parameters are developed for those systems in white color.
| : | Full description | |
| : | Full description for major phases | |
|
: |
Partial description for major phases |
|
| : | Extrapolation |
Database Validation and Application
Fe-Nd-B ternary system
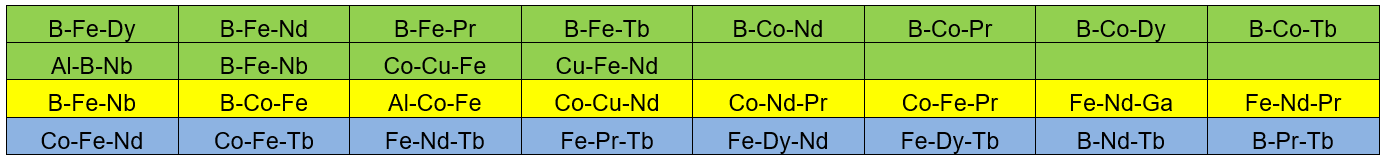
The Fe-Nd-B sintered magnet is a very important material to achieve high efficiency in electric-mechanical energy conversion devices such as main motors in electric vehicles and generators of wind-power turbines. The Fe-Nd-B is one of the key ternary systems in the multicomponent rare-earth permanent magnetic alloys. Figure 1 shows the calculated isothermal section at 900 °C and the isopleth at 5.88 at.% B in the Fe-Nd-B ternary system. The calculated phase stabilities are in good agreement with the experimental data [1985Bus,1989Zha].
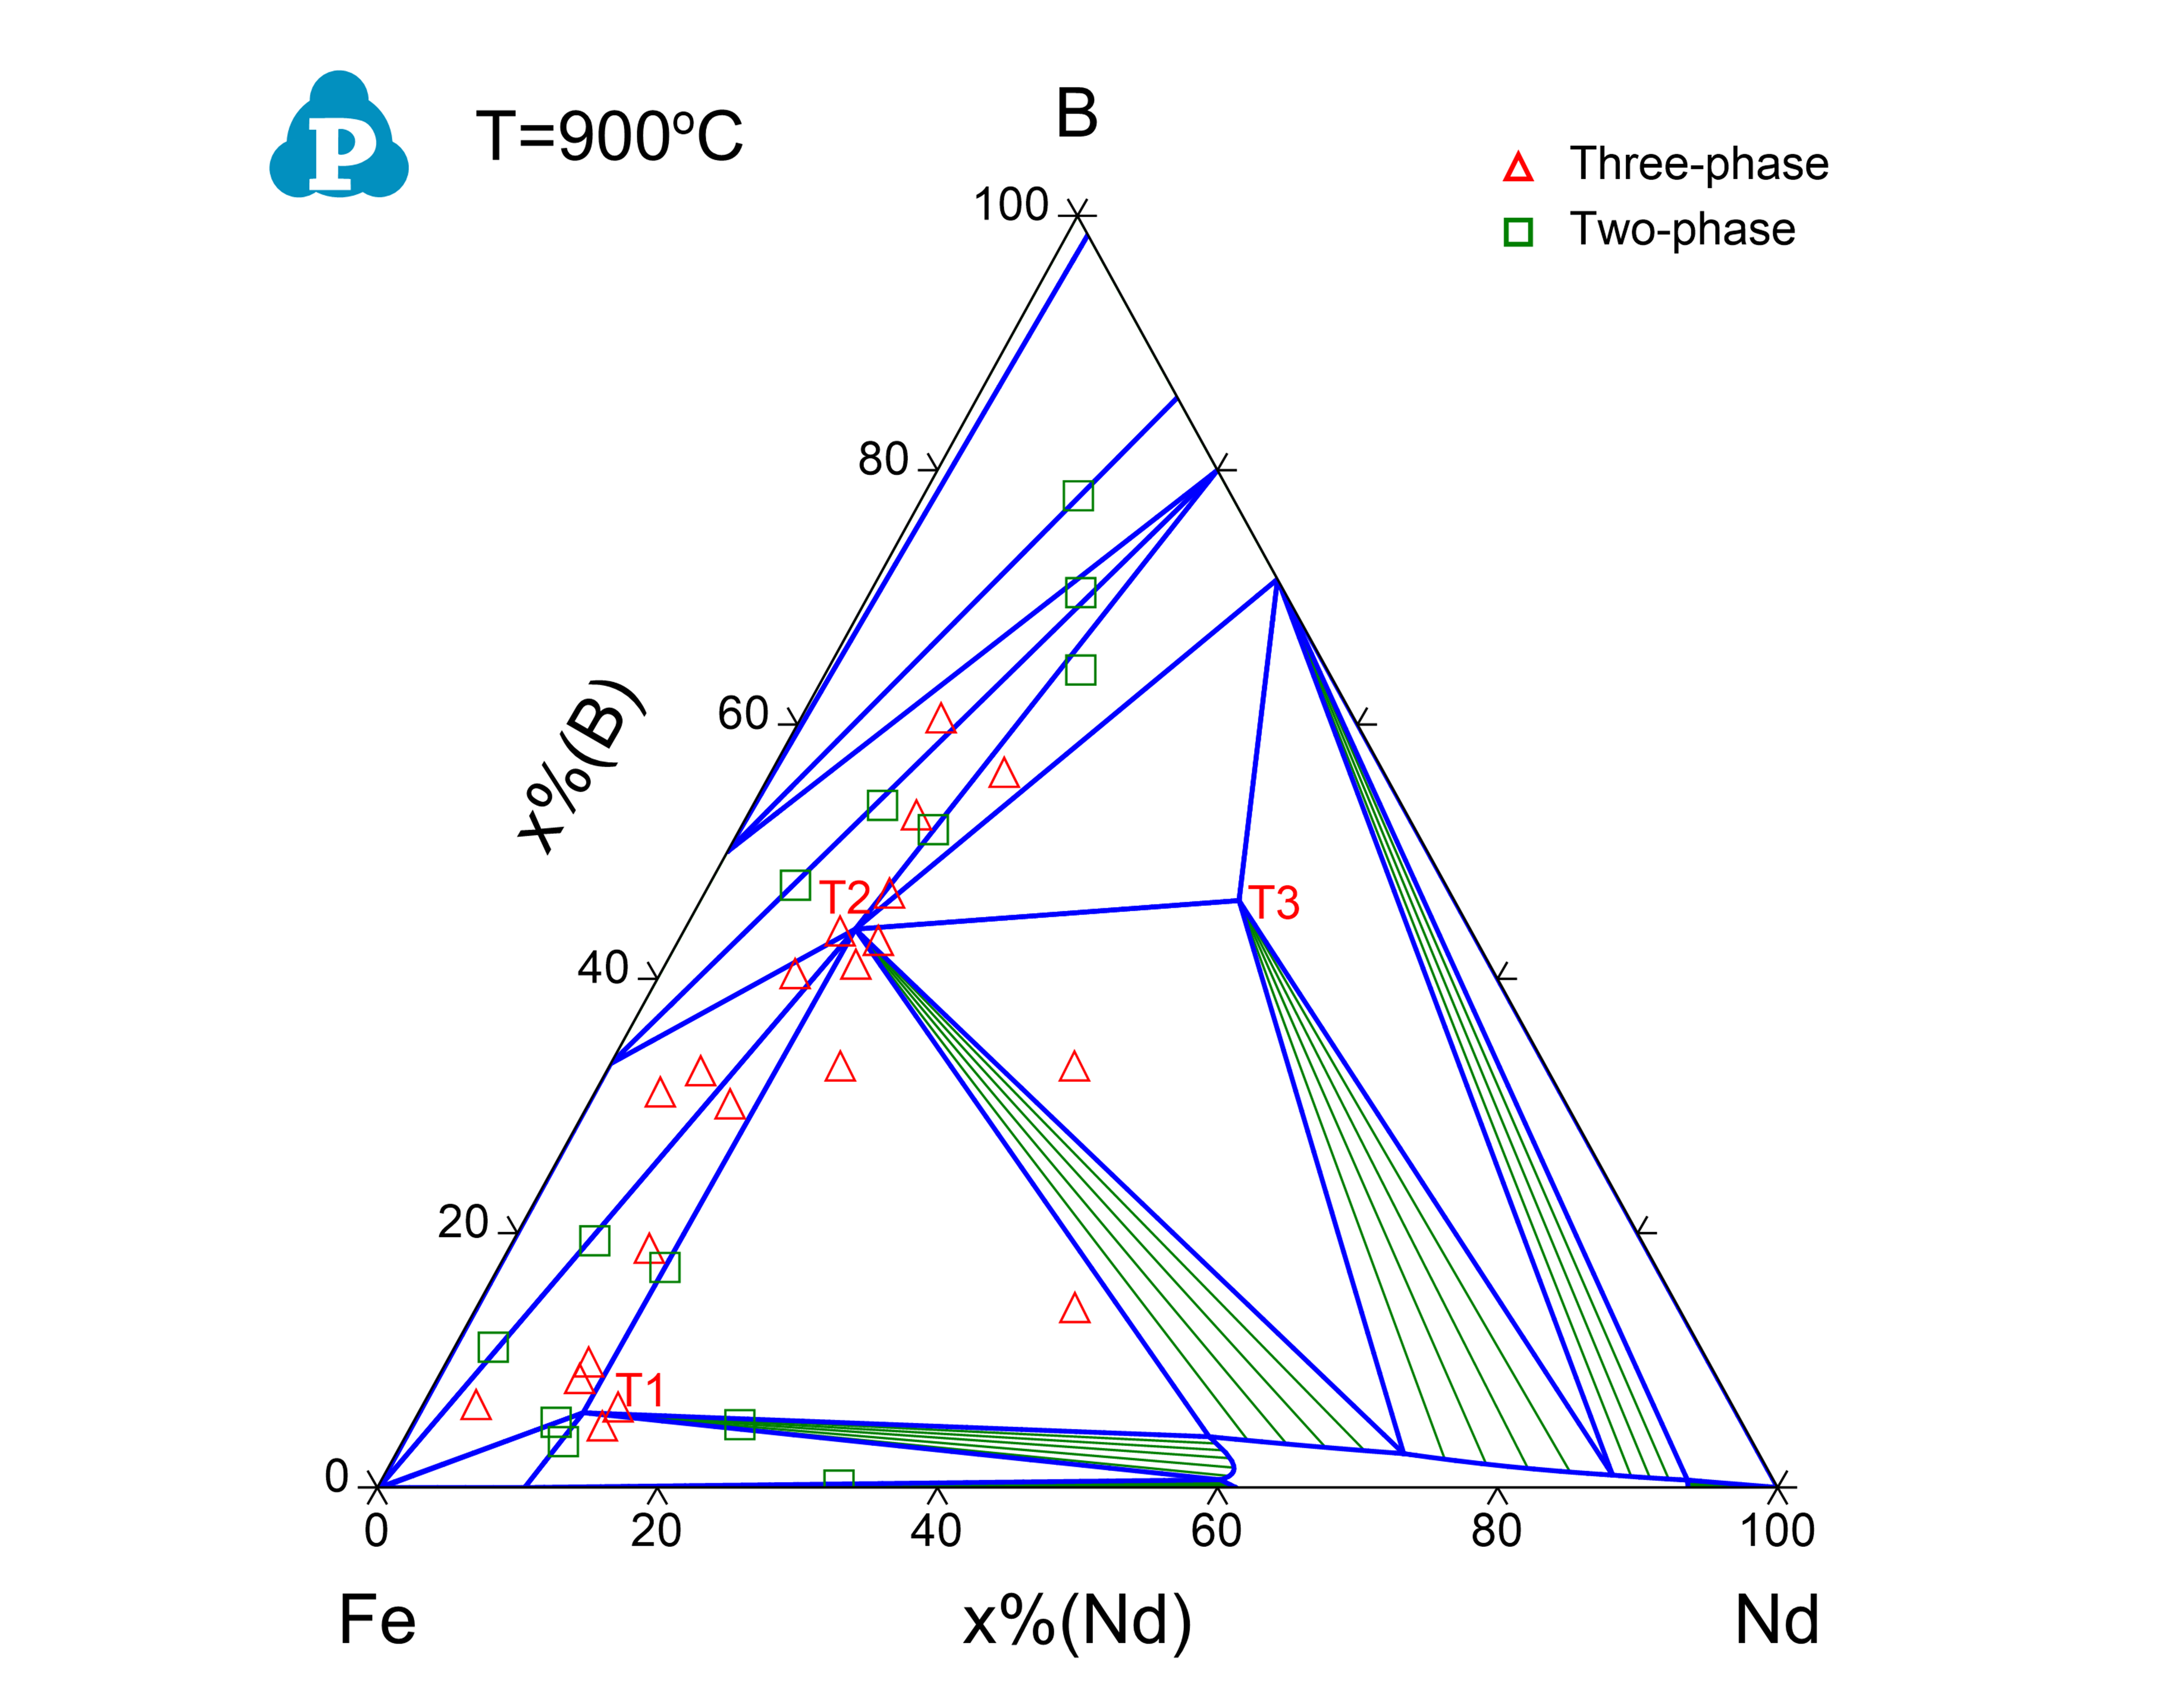
Figure 1: A calculated isothermal section at 900 °C and an isopleth at 5.88 at.% B in the Fe-Nd-B ternary system with experimental data [1985Bus,1989Zha] for comparison
T1 phase property
High-performance permanent magnet materials require high values of remanence (Br), intrinsic coercivity (Hci) and Curie temperature (TC) along with linear (normal) demagnetization curve B(H) or rectangular (intrinsic) demagnetization curve J(H). By selective alloying additions, the intrinsic properties, such as the magnetocrystalline anisotropy field (HA) and the Curie temperature (TC), and the extrinsic properties (mainly Hci) of the T1 phase can be successfully improved. Partial substitution of Fe by Co increases TC but decreases Hci. On the other hand, substitution of Nd by Dy, Pr and Tb enhances HA but decreases the saturation magnetization (Bs). In a similar manner, substitution of Fe by Al, Cu, Ga, Nb, etc. results in an improvement of Hci due to microstructural modifications. The challenge lies, therefore, in selecting an appropriate combination of elemental additions to the Nd-Fe-B based magnetic materials that would maximize the essential magnetic properties. The PanMag thermodynamic database can be used to understand and predict the effects of alloying elements on the properties of magnet materials, therefore help to select elemental additions to achieve the essential magnetic properties.
The most important T1-RE2M14B phase is described using a 3-sublattice model: (Dy,Nd,Pr,Tb)0.11764(Al,Co,Fe)0.82354B0.05882 in this thermodynamic database. Where RE represents rare earth elements: Dy, Nd, Pr, and Tb. M represents metal elements: Al, Co, and Fe. Figure 2 shows the calculated heat capacity of the T1-Nd2Fe14B phase which is in good agreement with the experimental data [1991Lui]. Figure 3 shows the calculated Curie temperature of the T1-Nd2(CoxFe1-x)14B as a function of Co composition in the second sublattice, which accords to the experimental data [1986Ped, 2001Den] very well. A clear trend is shown in Figure 3 that replacing Fe with Co results in the increase of Curie temperature for the T1 phase. Figure 4 compares the calculated and measured Curie temperatures for a series of T1 phase [1985Bus2, 1986Ped, 1986Ped2, 1987Bol, 1987Hir, 1987Par, 1987Ped, 1987Ped2, 1987Pou, 1987Sag, 1988Jia, 1988Jur, 1988Pou, 1989Jur, 1990Jur, 2001Den], where excellent agreement is obtained.

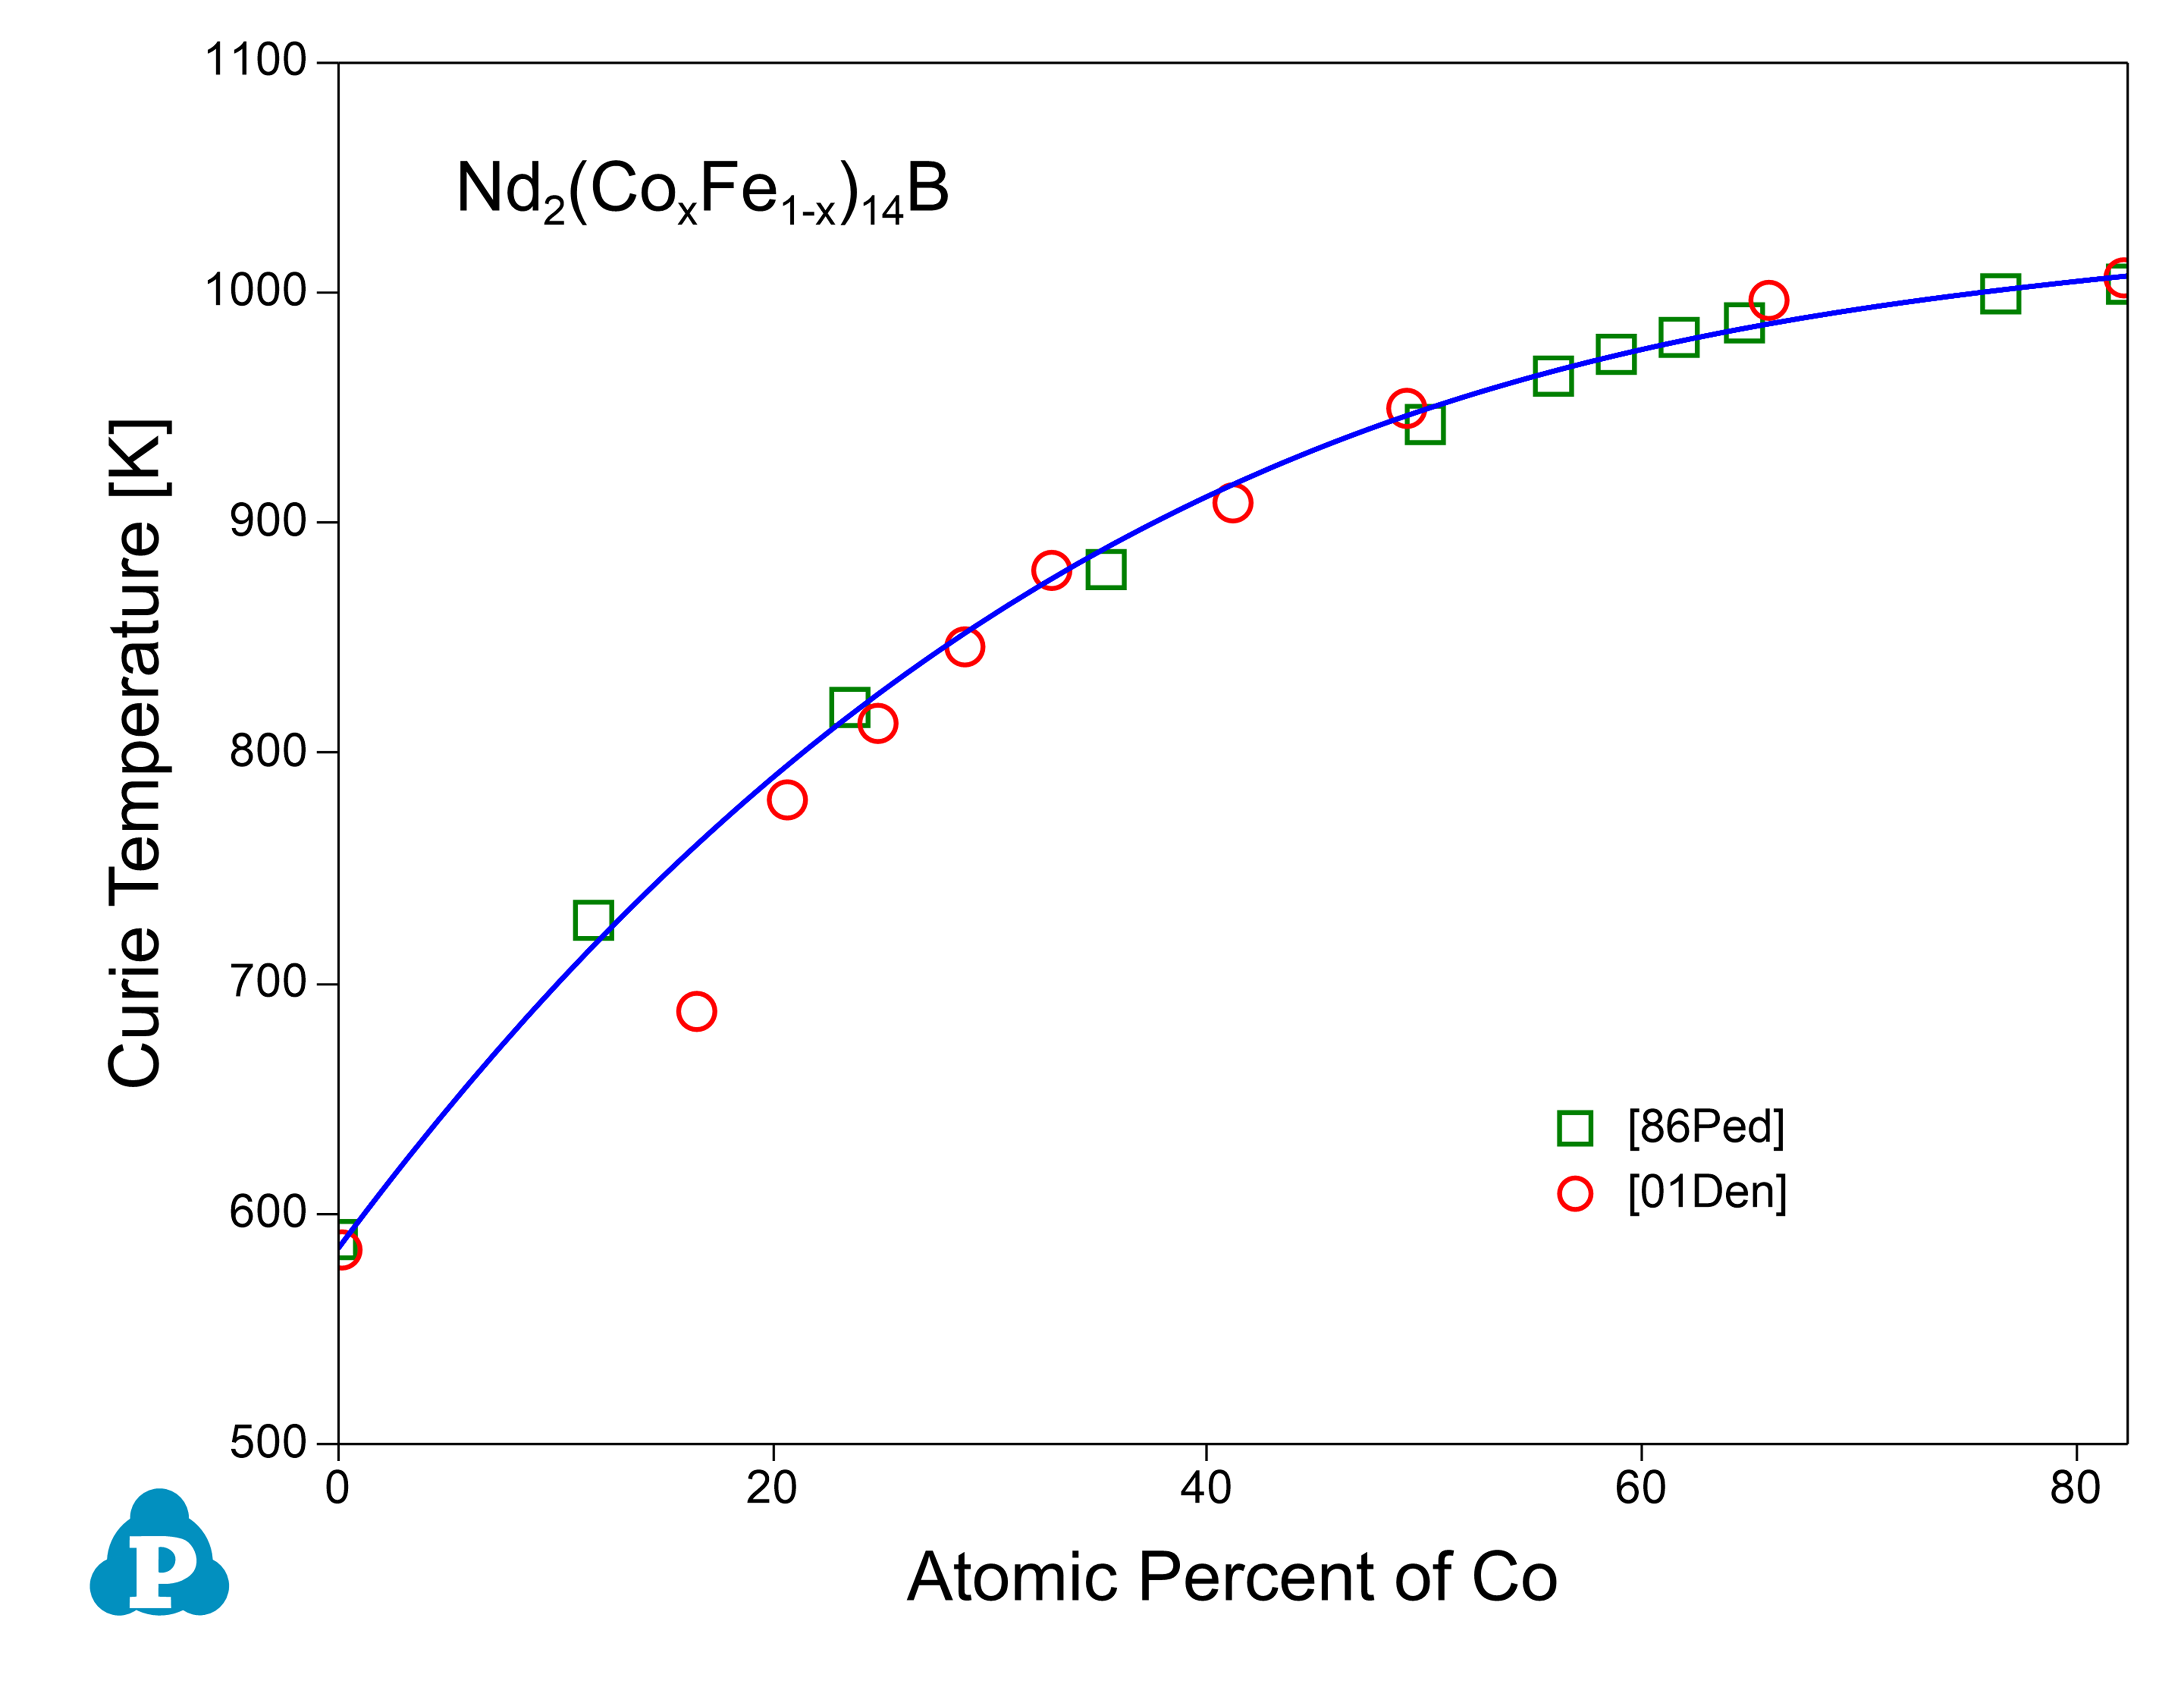
Figure 3: Comparison between the calculated and experimentally measured Curie temperatures for T1-Nd2(CoxFe1-x)14B alloy
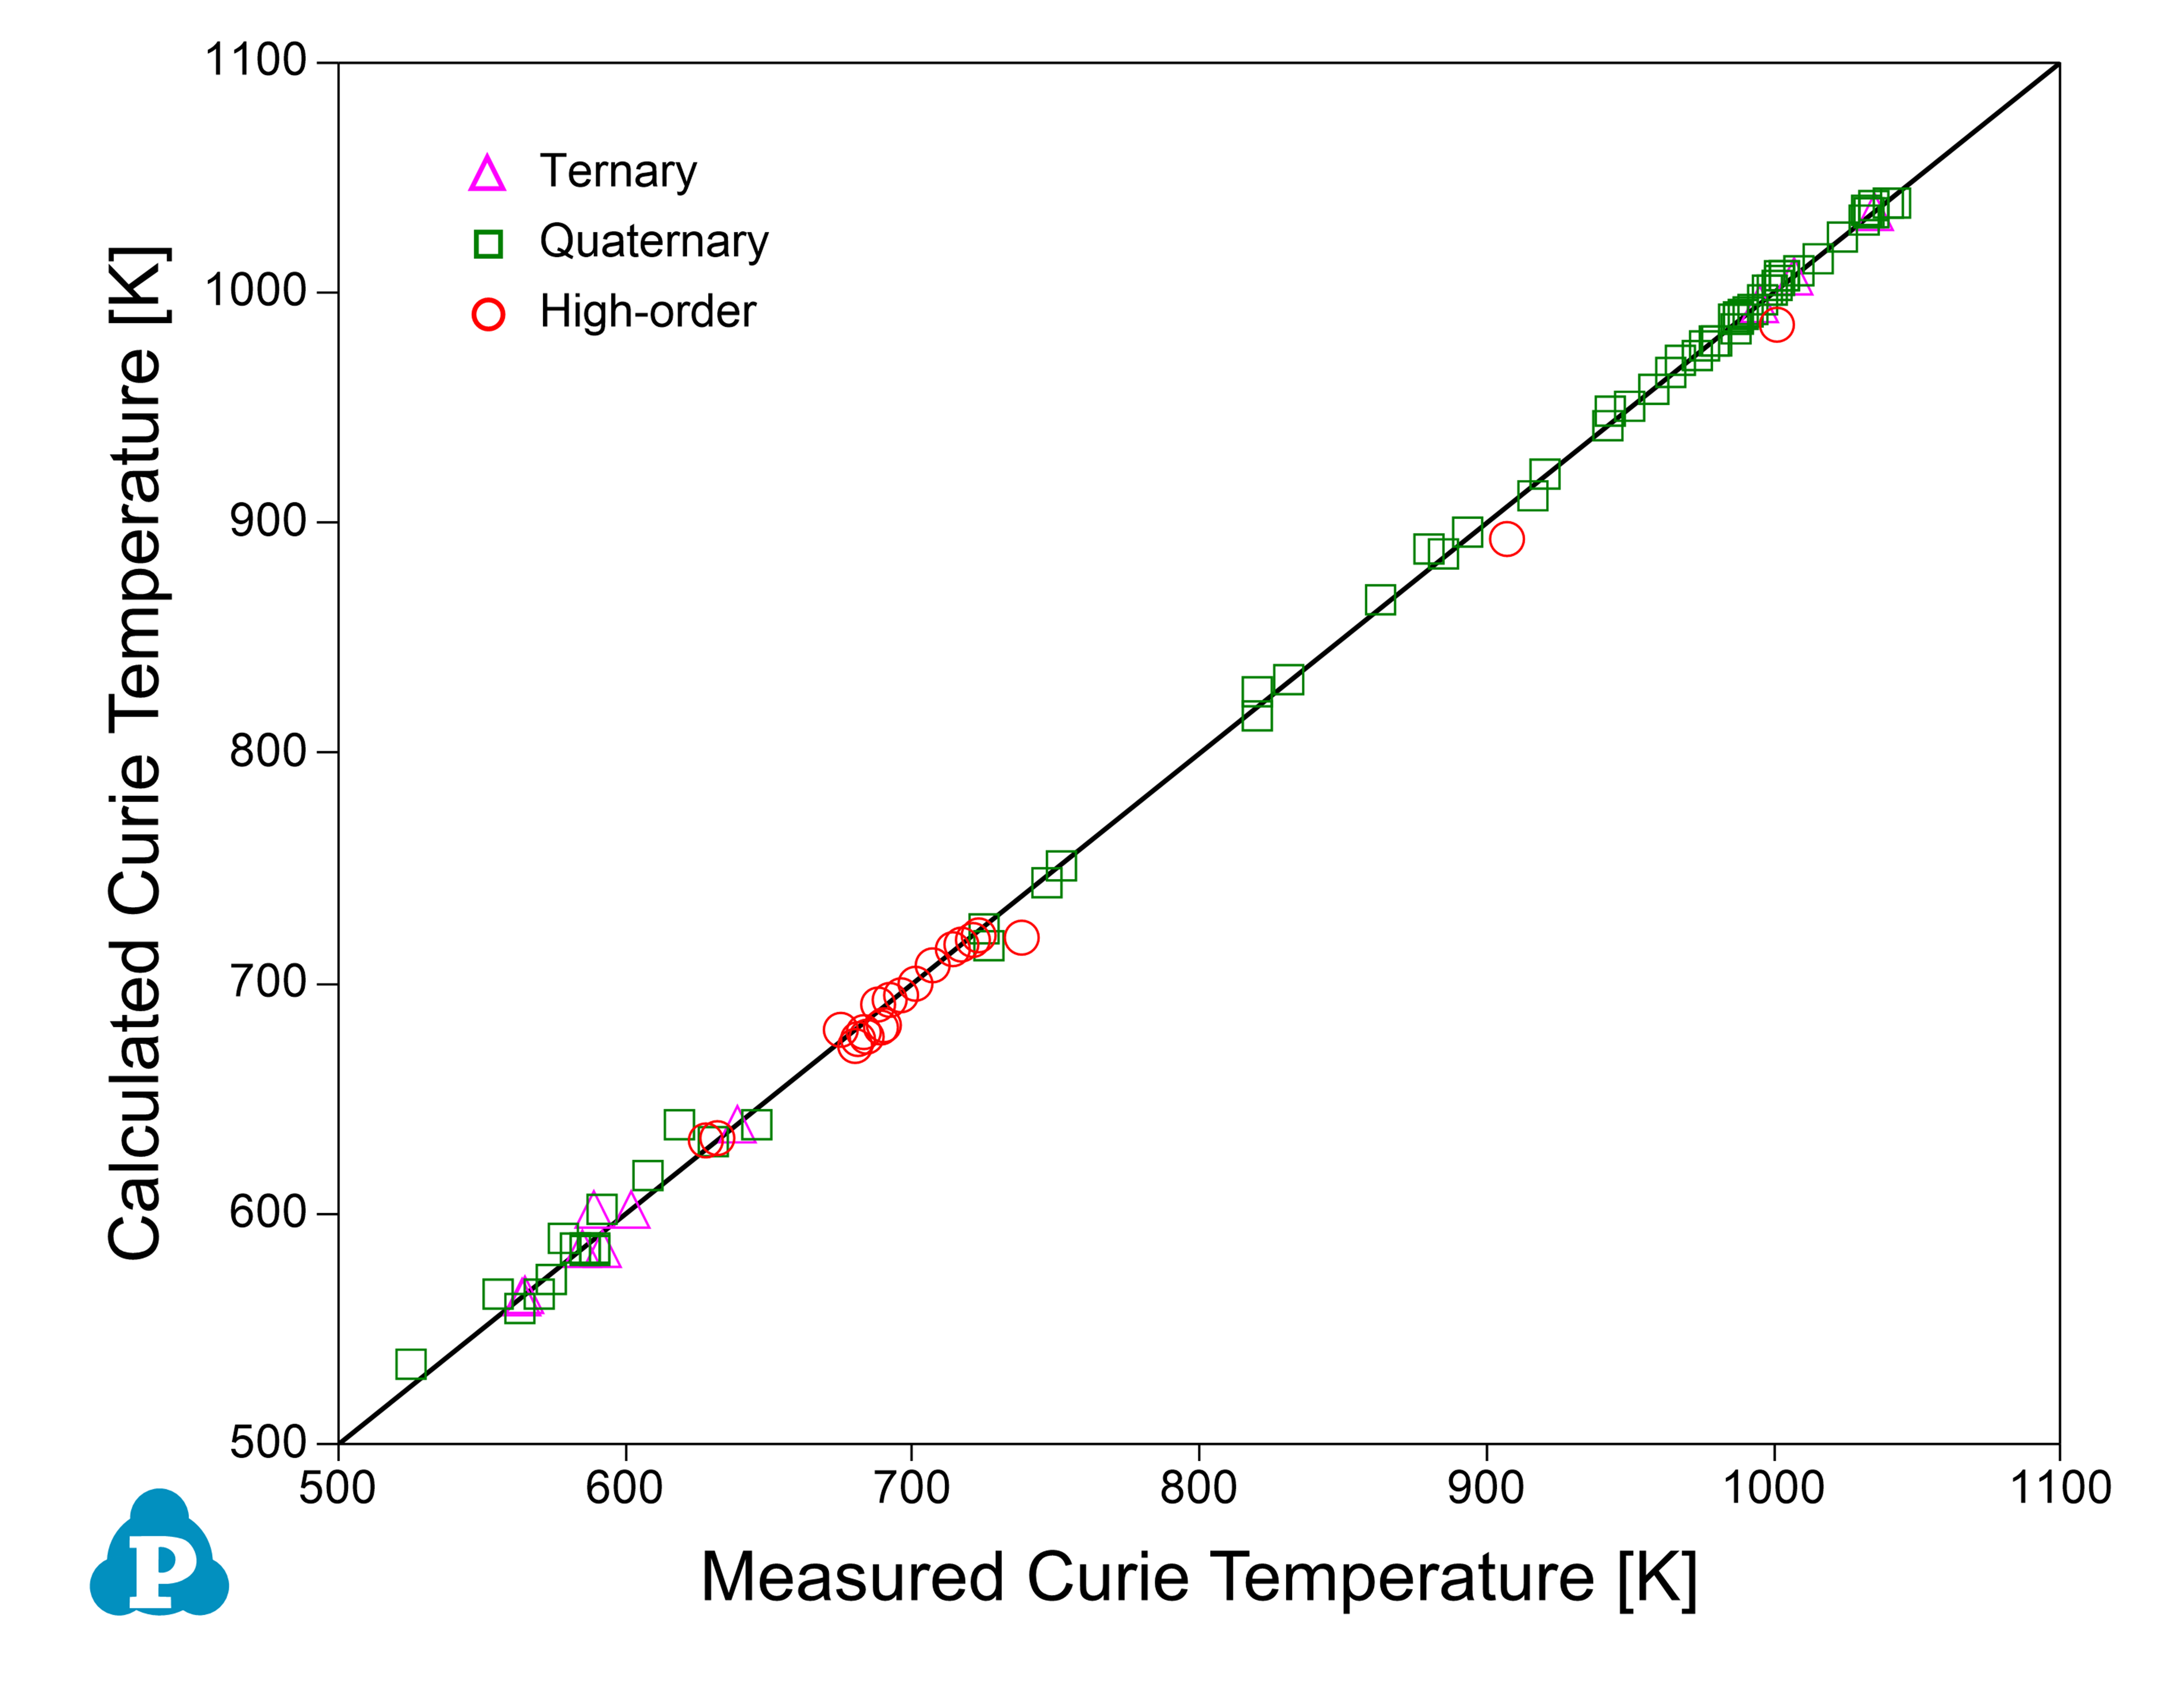
Figure 4: Comparison between the calculated and experimentally measured Curie temperatures for a series of T1 alloys
Figure 5 shows the calculated saturation magnetization Bs (in unit T) at room temperature for the T1-Pr2(Fe1-yCoy)14B phase as a function of Co composition in the second sublattice. Experimental data [1986Ped, 1987Bol] are plotted on the same figure for comparison. Magnetocrystalline anisotropy field HA (in unit kOe) is calculated at room temperature for the T1-Dy2(Fe1-yCoy)14B phase as a function of Co composition in the second sublattice as shown in Figure 6 with experimental data [1987Ped2] for comparison.
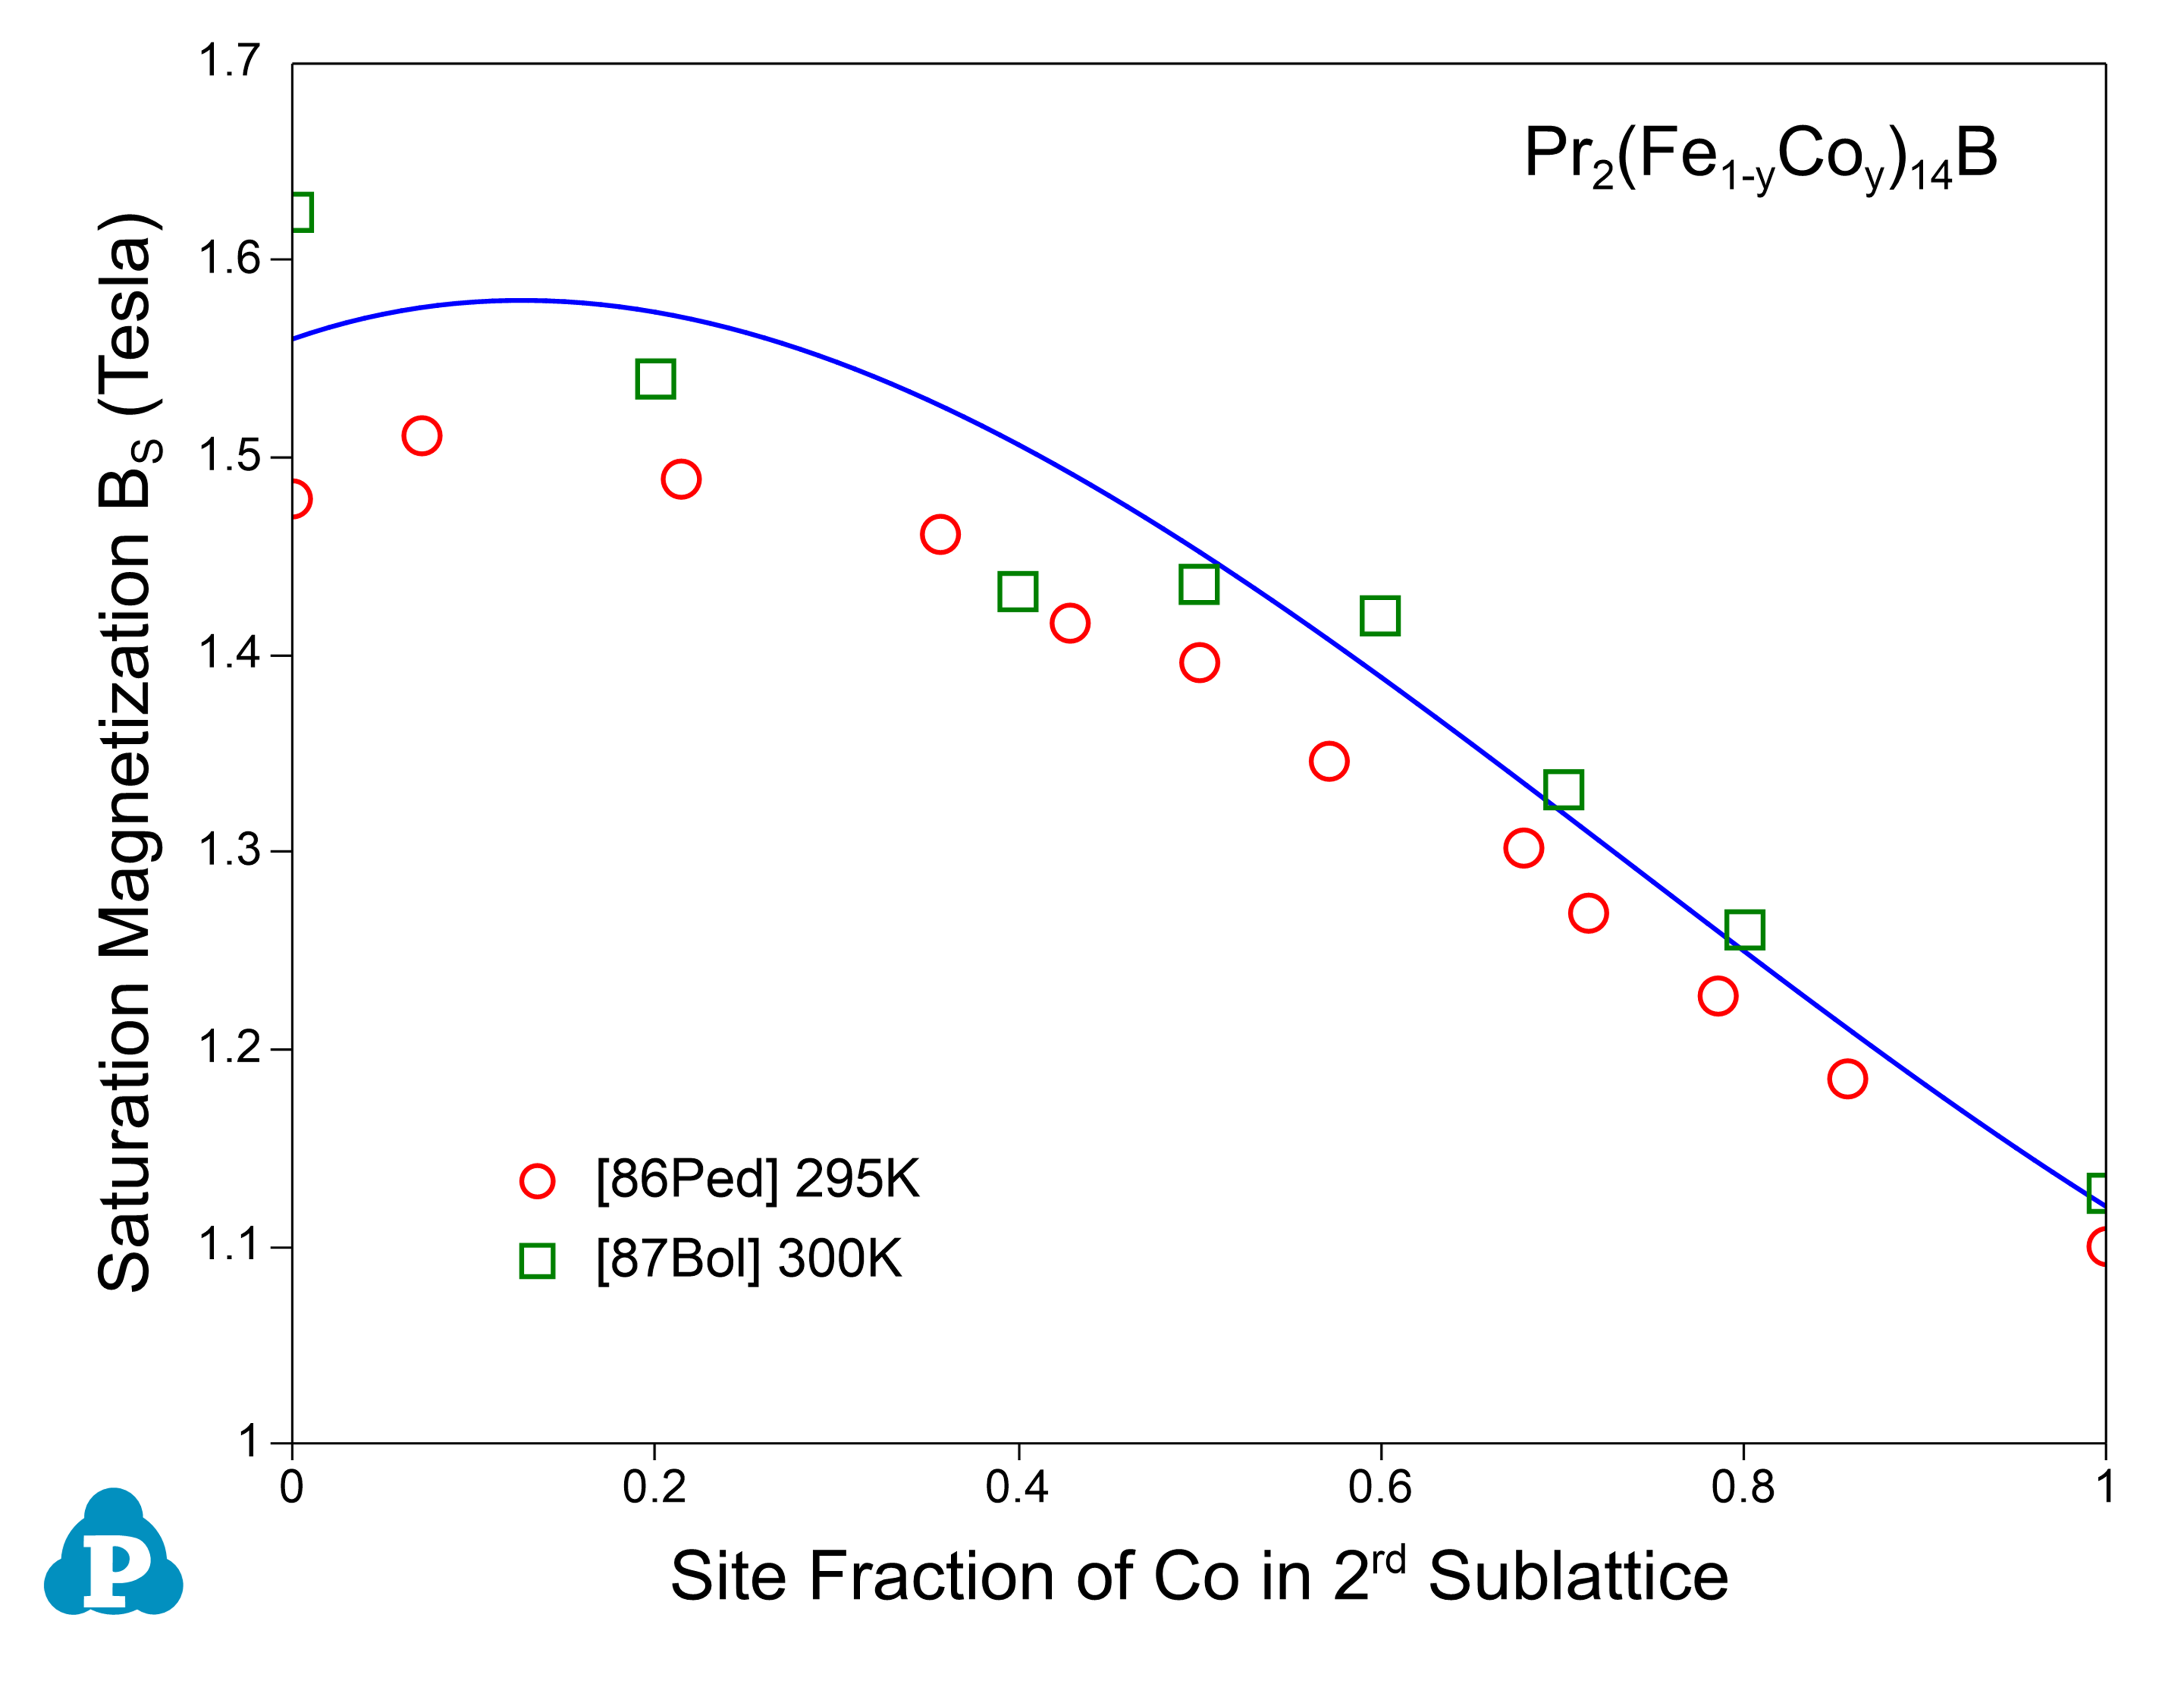
Figure 5: Calculated saturation magnetization BS at room temperature with experimental data [86Ped, 87Bol]

Figure 6: Calculated magnetocrystalline anisotropy field HA at room temperature with experimental data [87Ped]
Microstructure
The relatively low coercivity and poor thermal stability of the ternary Nd-Fe-B sintered magnets limit their applications. The coercivity of the Nd-Fe-B magnets can be enhanced by substituting part of Nd with other rare earth elements and refining the size of the Nd2Fe14B grains. In the post-sinter annealing process, some Nd-rich phases will melt and infiltrate into the grain boundaries to form intergranular phases. The addition of trace alloying elements, such as Cu, Ga and Al, can lower the melting temperature and improve the wettability at grain boundary (GB), which can benefit the formation of nonferromagnetic GB phases and improves coercivity.
In order to reduce heavy rare-earth (HRE, such as Tb and Dy) consumption, grain boundary diffusion process (GBDP) offers another route to fabricate high-coercive Nd-Fe-B magnets, aiming at an inhomogeneous microstructure with HRE-rich shell/HRE-lean core [2021Liu]. GBDP enhances the coercivity of the magnet mainly by retarding the nucleation of reversal domains at the surface of Nd2Fe14B grains with the “hard” HRE-rich shell, while high remanence can be simultaneously achieved by the “soft” HRE-lean core.
Coercivity is often expressed as a linear correlation between HC and HA:  , where α and
  are phenomenological parameters which can be determined by analyzing temperature dependence of HC , HA and MS assuming the microstructure of the material does not change with temperature. The first term indicates the influence of the defects and grain misalignment on the anisotropy field and the second term is related to the reduction of coercivity due to the demagnetization field [2021Li]. The effective demagnetization field,
  , decreases as the grain size decreases, giving rise to a larger coercivity for smaller grain size.
  can be reduced in hot-deformed magnet by reducing the aspect ratio of the platelet-like grains and the value of α can be increased in GB engineered Fe-Nd-B magnets, e.g. the Gd-dopped Nd-rich B-lean sintered magnet after optimized annealing process or the hot-deformed magnets that were diffusion processed with core-shell structure.
Fabrication of high-performance permanent magnets requires precise control of the microstructure. The optimum microstructure proposed in [2017Hir] is illustrated in Figure 7 (Figure adopted from [2021Abe]), where micrometer-sized grains of the Nd2Fe14B phase (Blue) is coated by a thin non-magnetic grain boundary phase (yellow).

In the following, we will demonstrate the capability of PanMag database in obtaining the microstructure information, i.e., the phases formed under variety of processing conditions, and compare the simulated results with the experimental observations.
a) Alloy Fe-14.2Nd-6.3B-0.1Cu (at.%)
In the Fe-Nd-B ternary system, the dhcp-Nd phase forms with T1-Nd2Fe14B phase and Fe17Nd5 phase through a eutectic reaction at 680 °C as shown in Figure 8. The addition of trace amount of Cu can help stabilize the liquid phase to a much lower temperature. As shown in Figure 8(b), addition of only 0.1 at% of Cu helps maintain the last drop of liquid to the temperature as low as 520 °C, which is beneficial to the formation of desired microstructure.
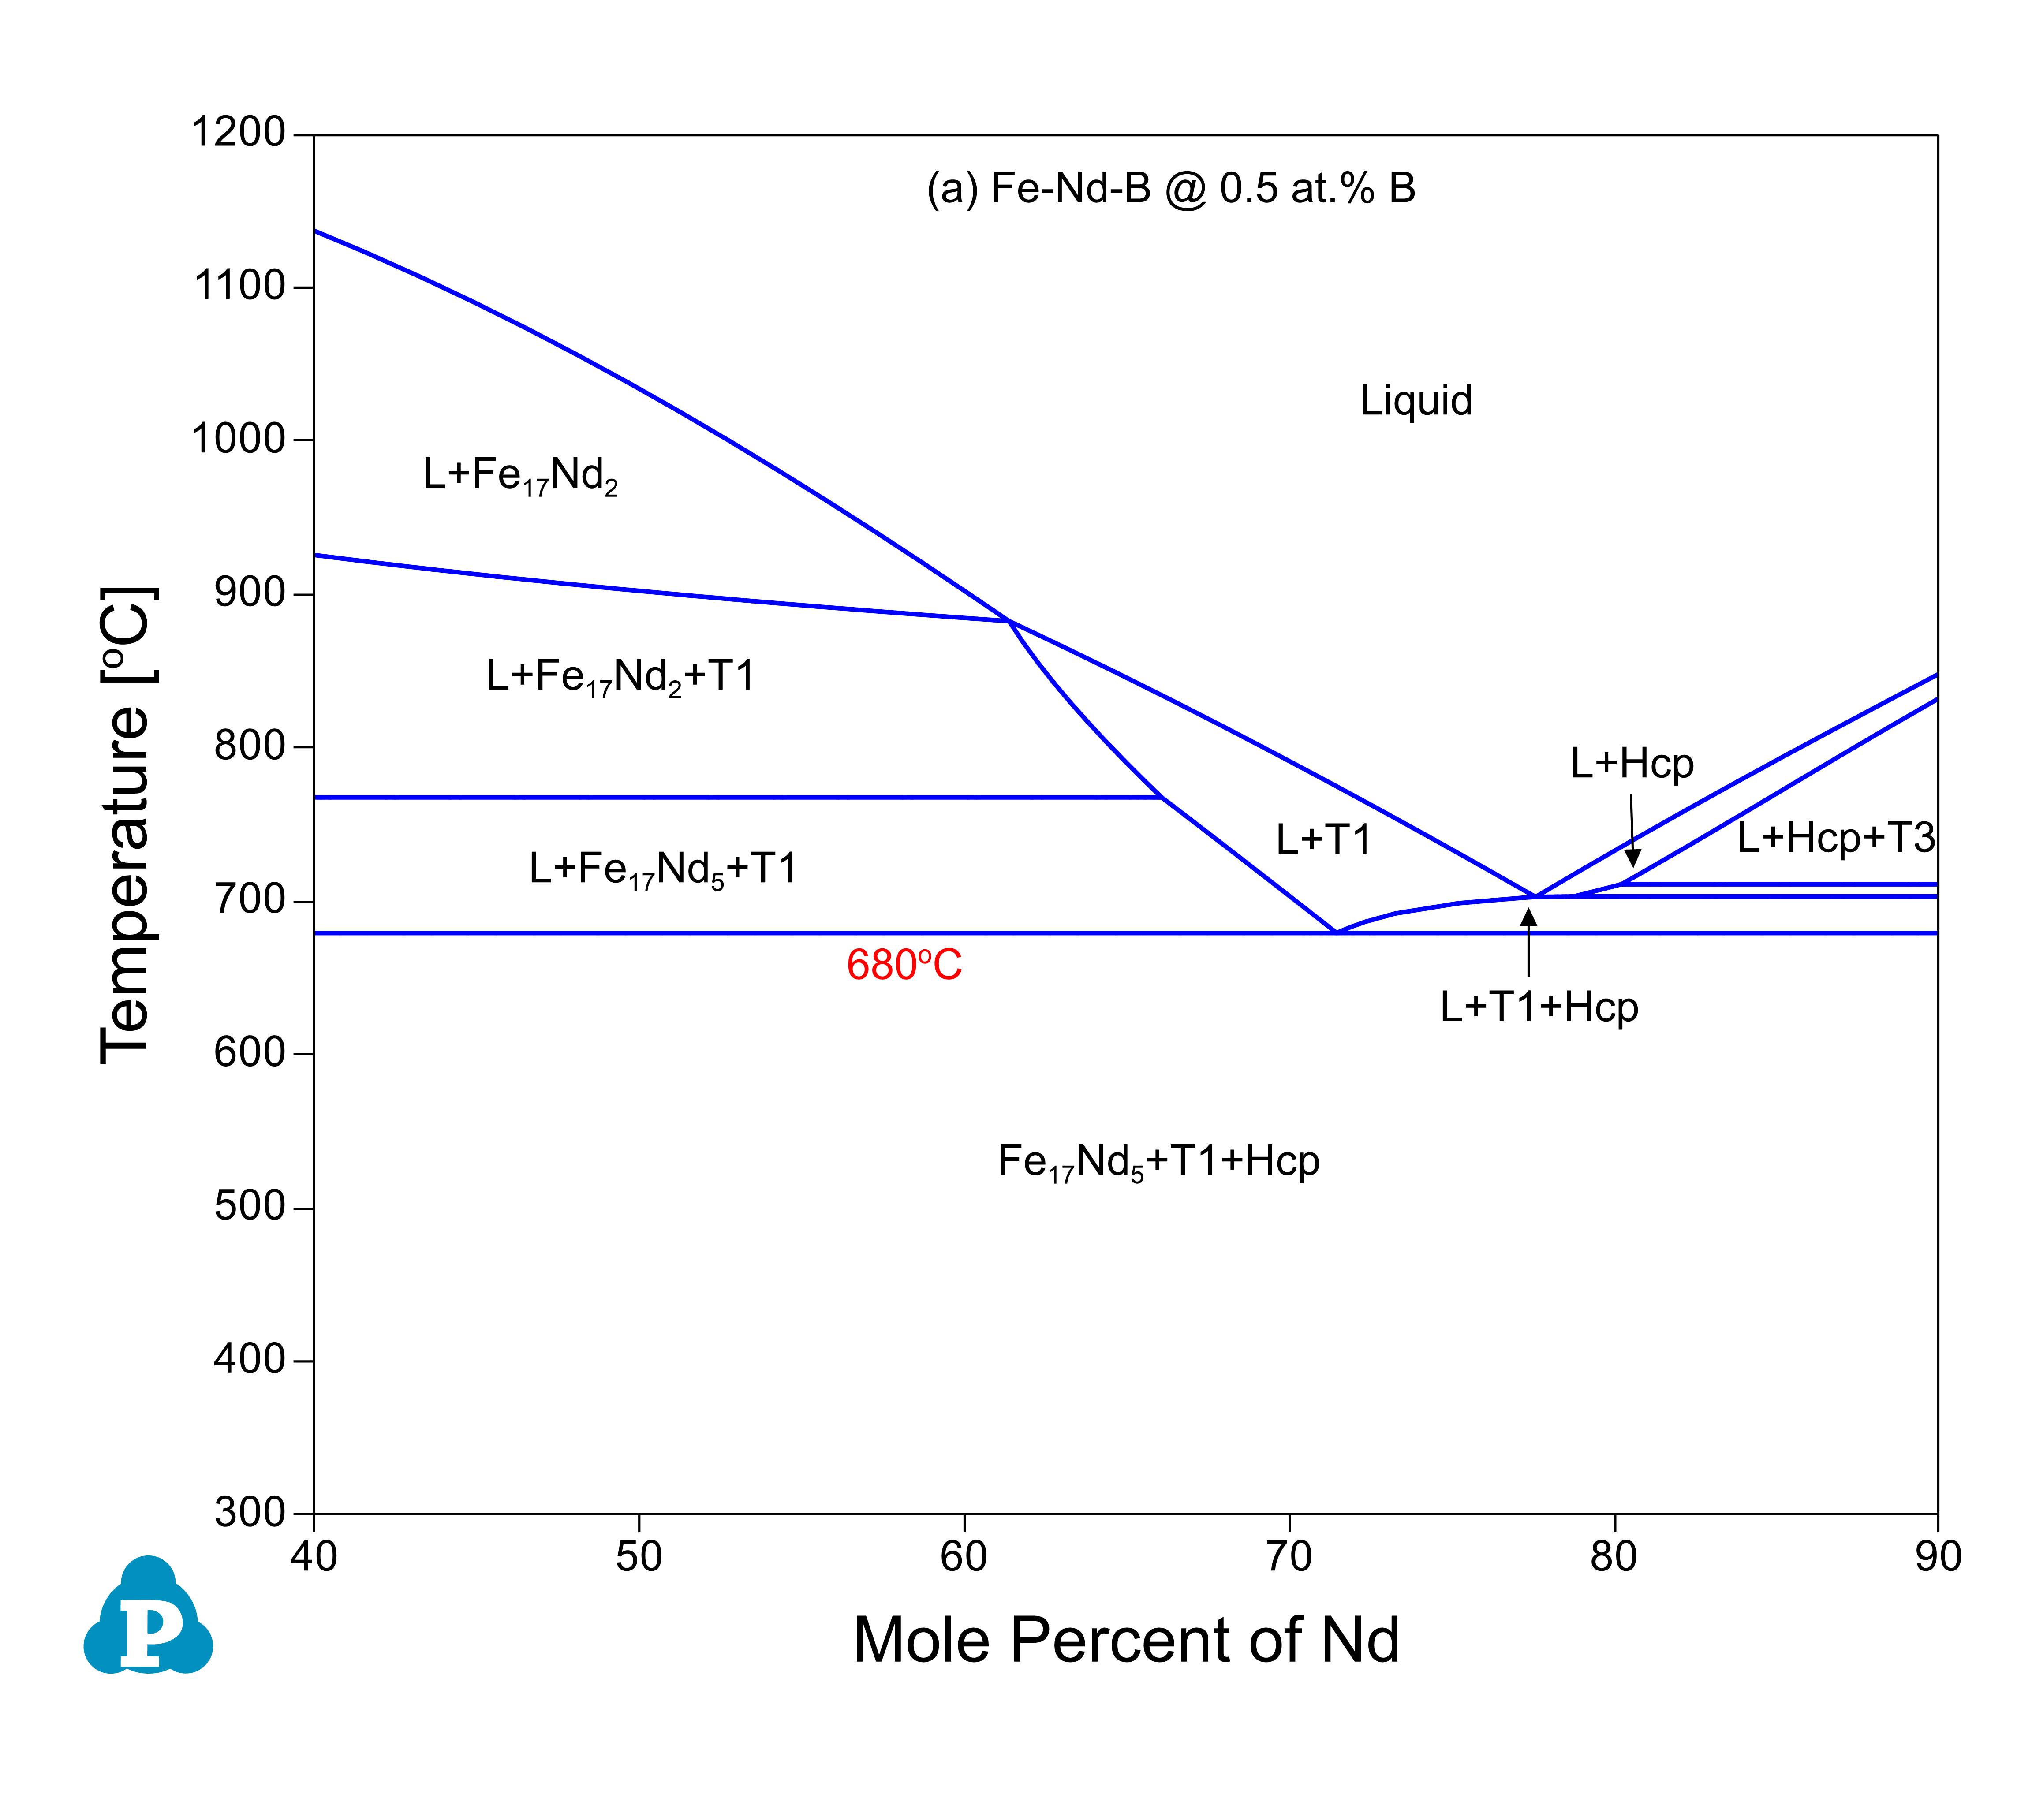
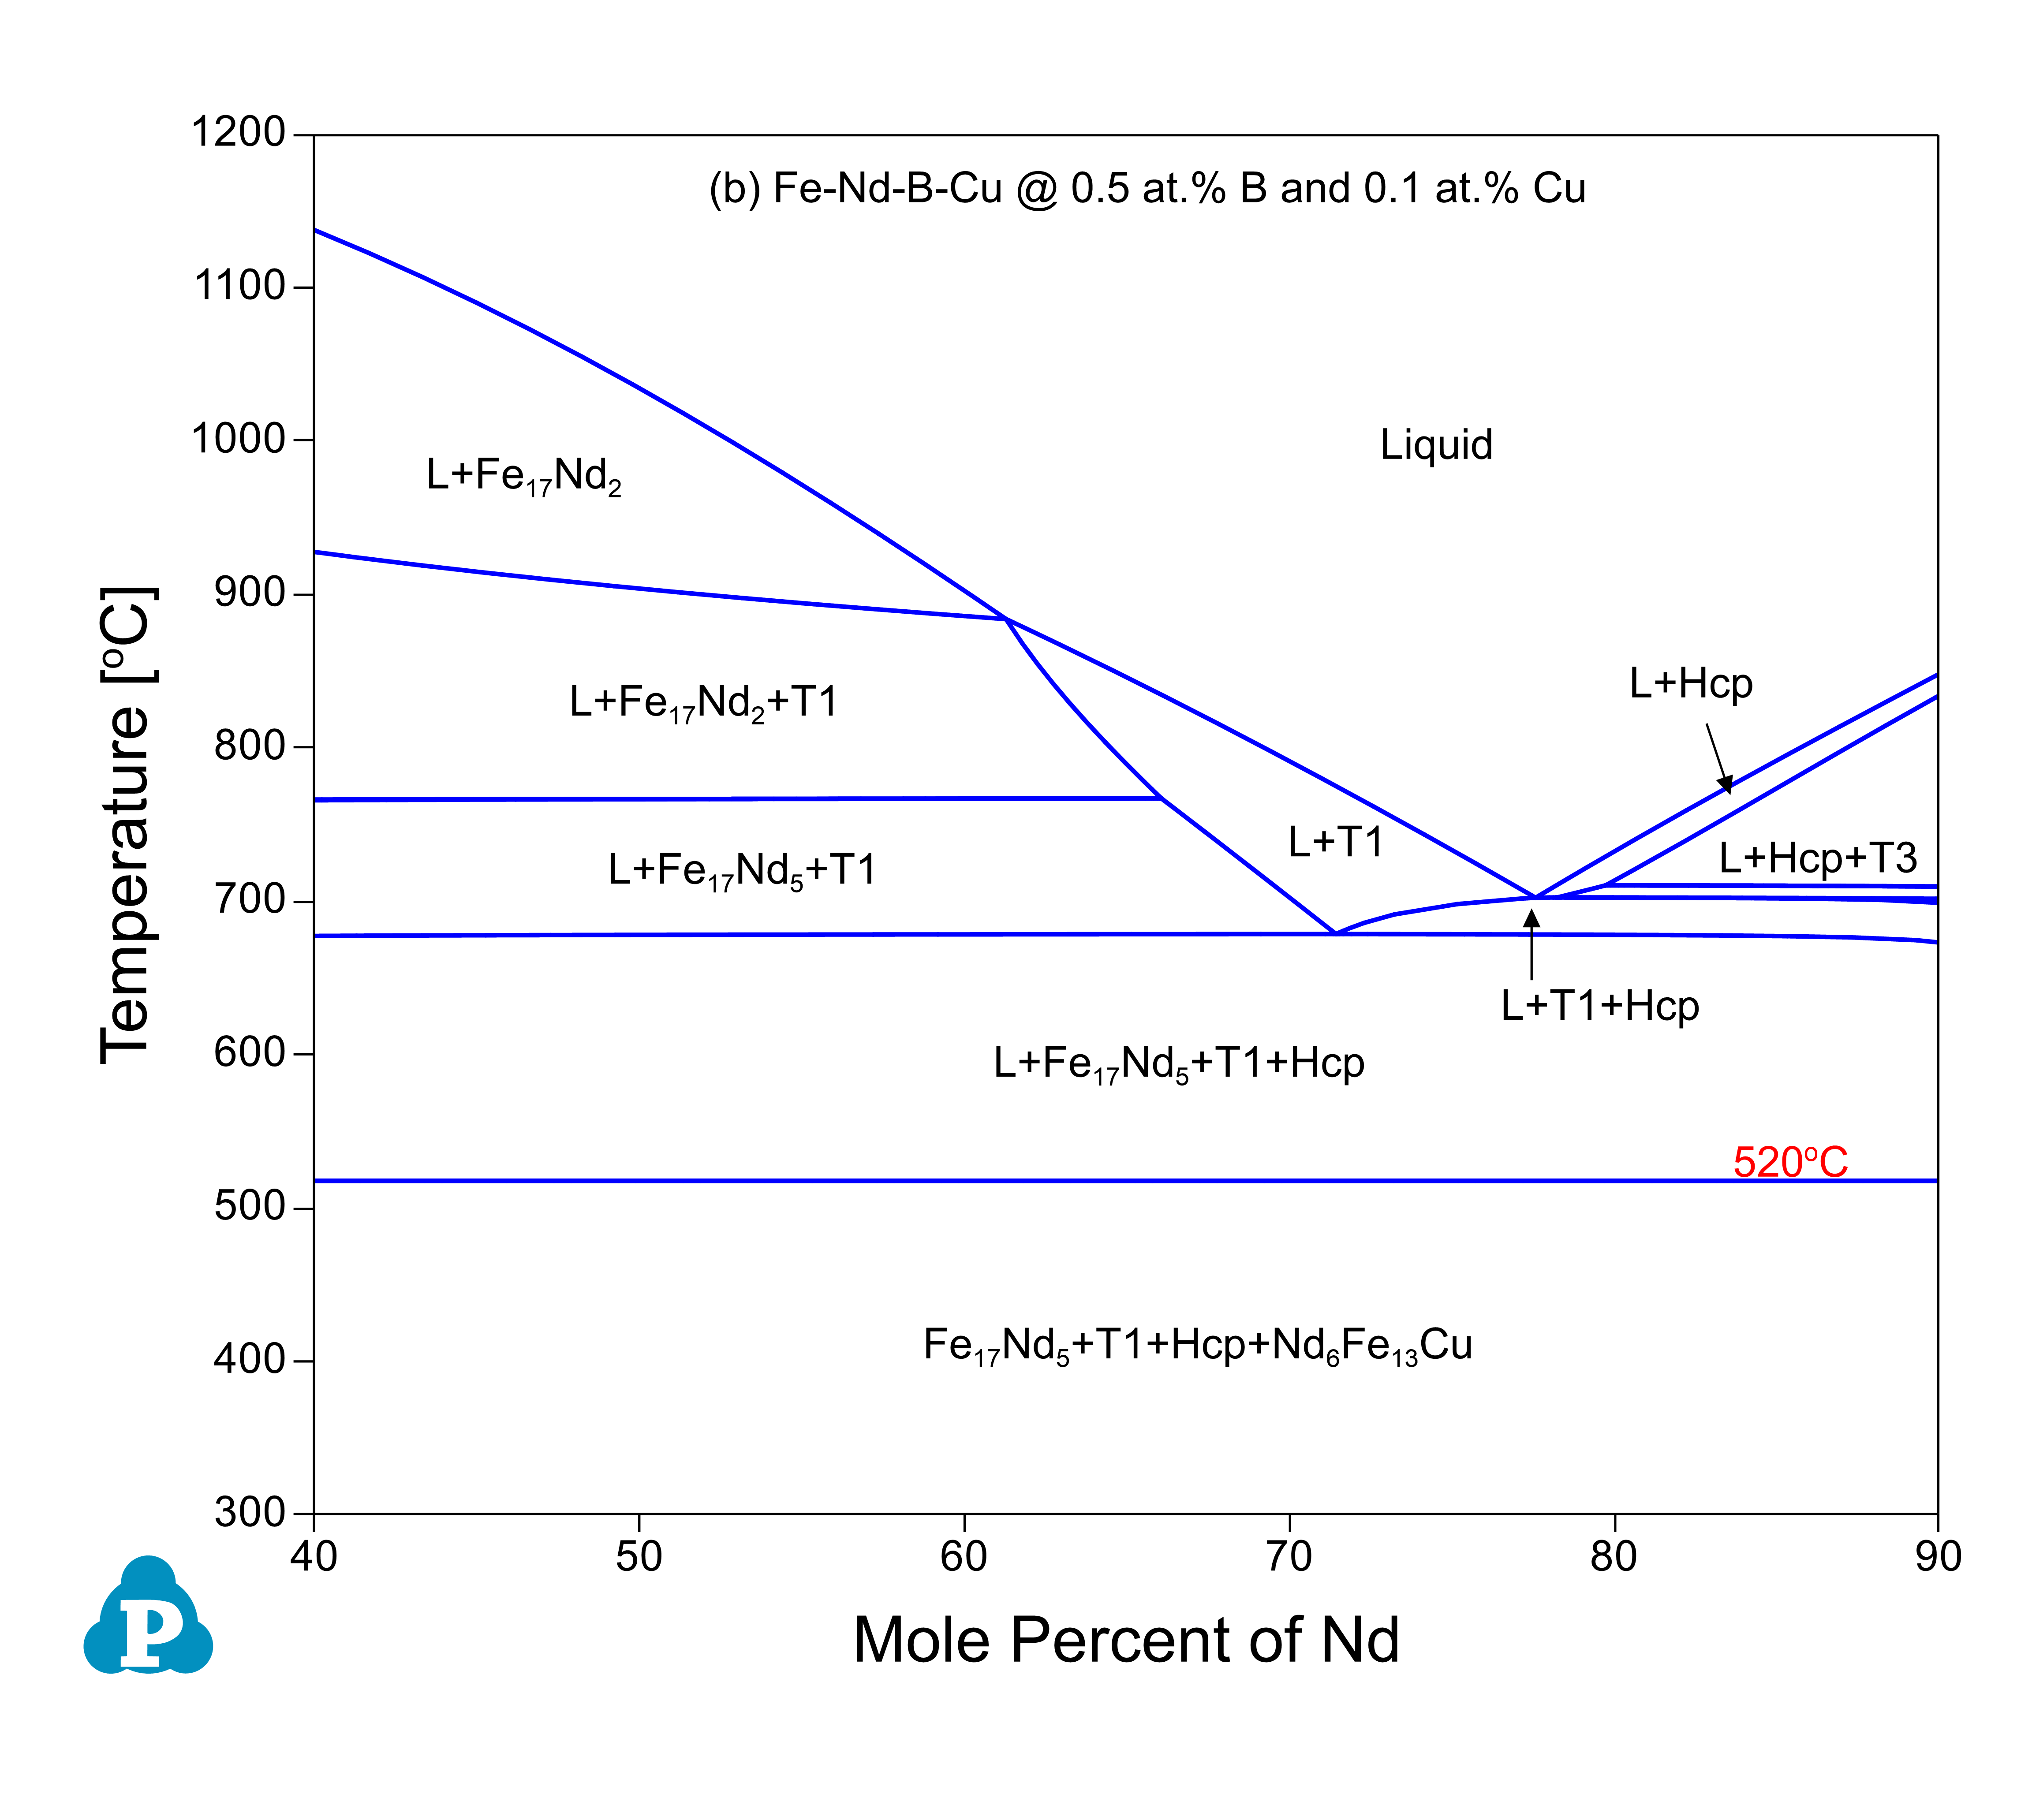
Figure 8: Calculated isopleths at 0.5 at.% B in the Fe-Nd-B ternary system and at 0.5 at.% B and 0.1 at.% Cu in the Fe-Nd-B-Cu quaternary system
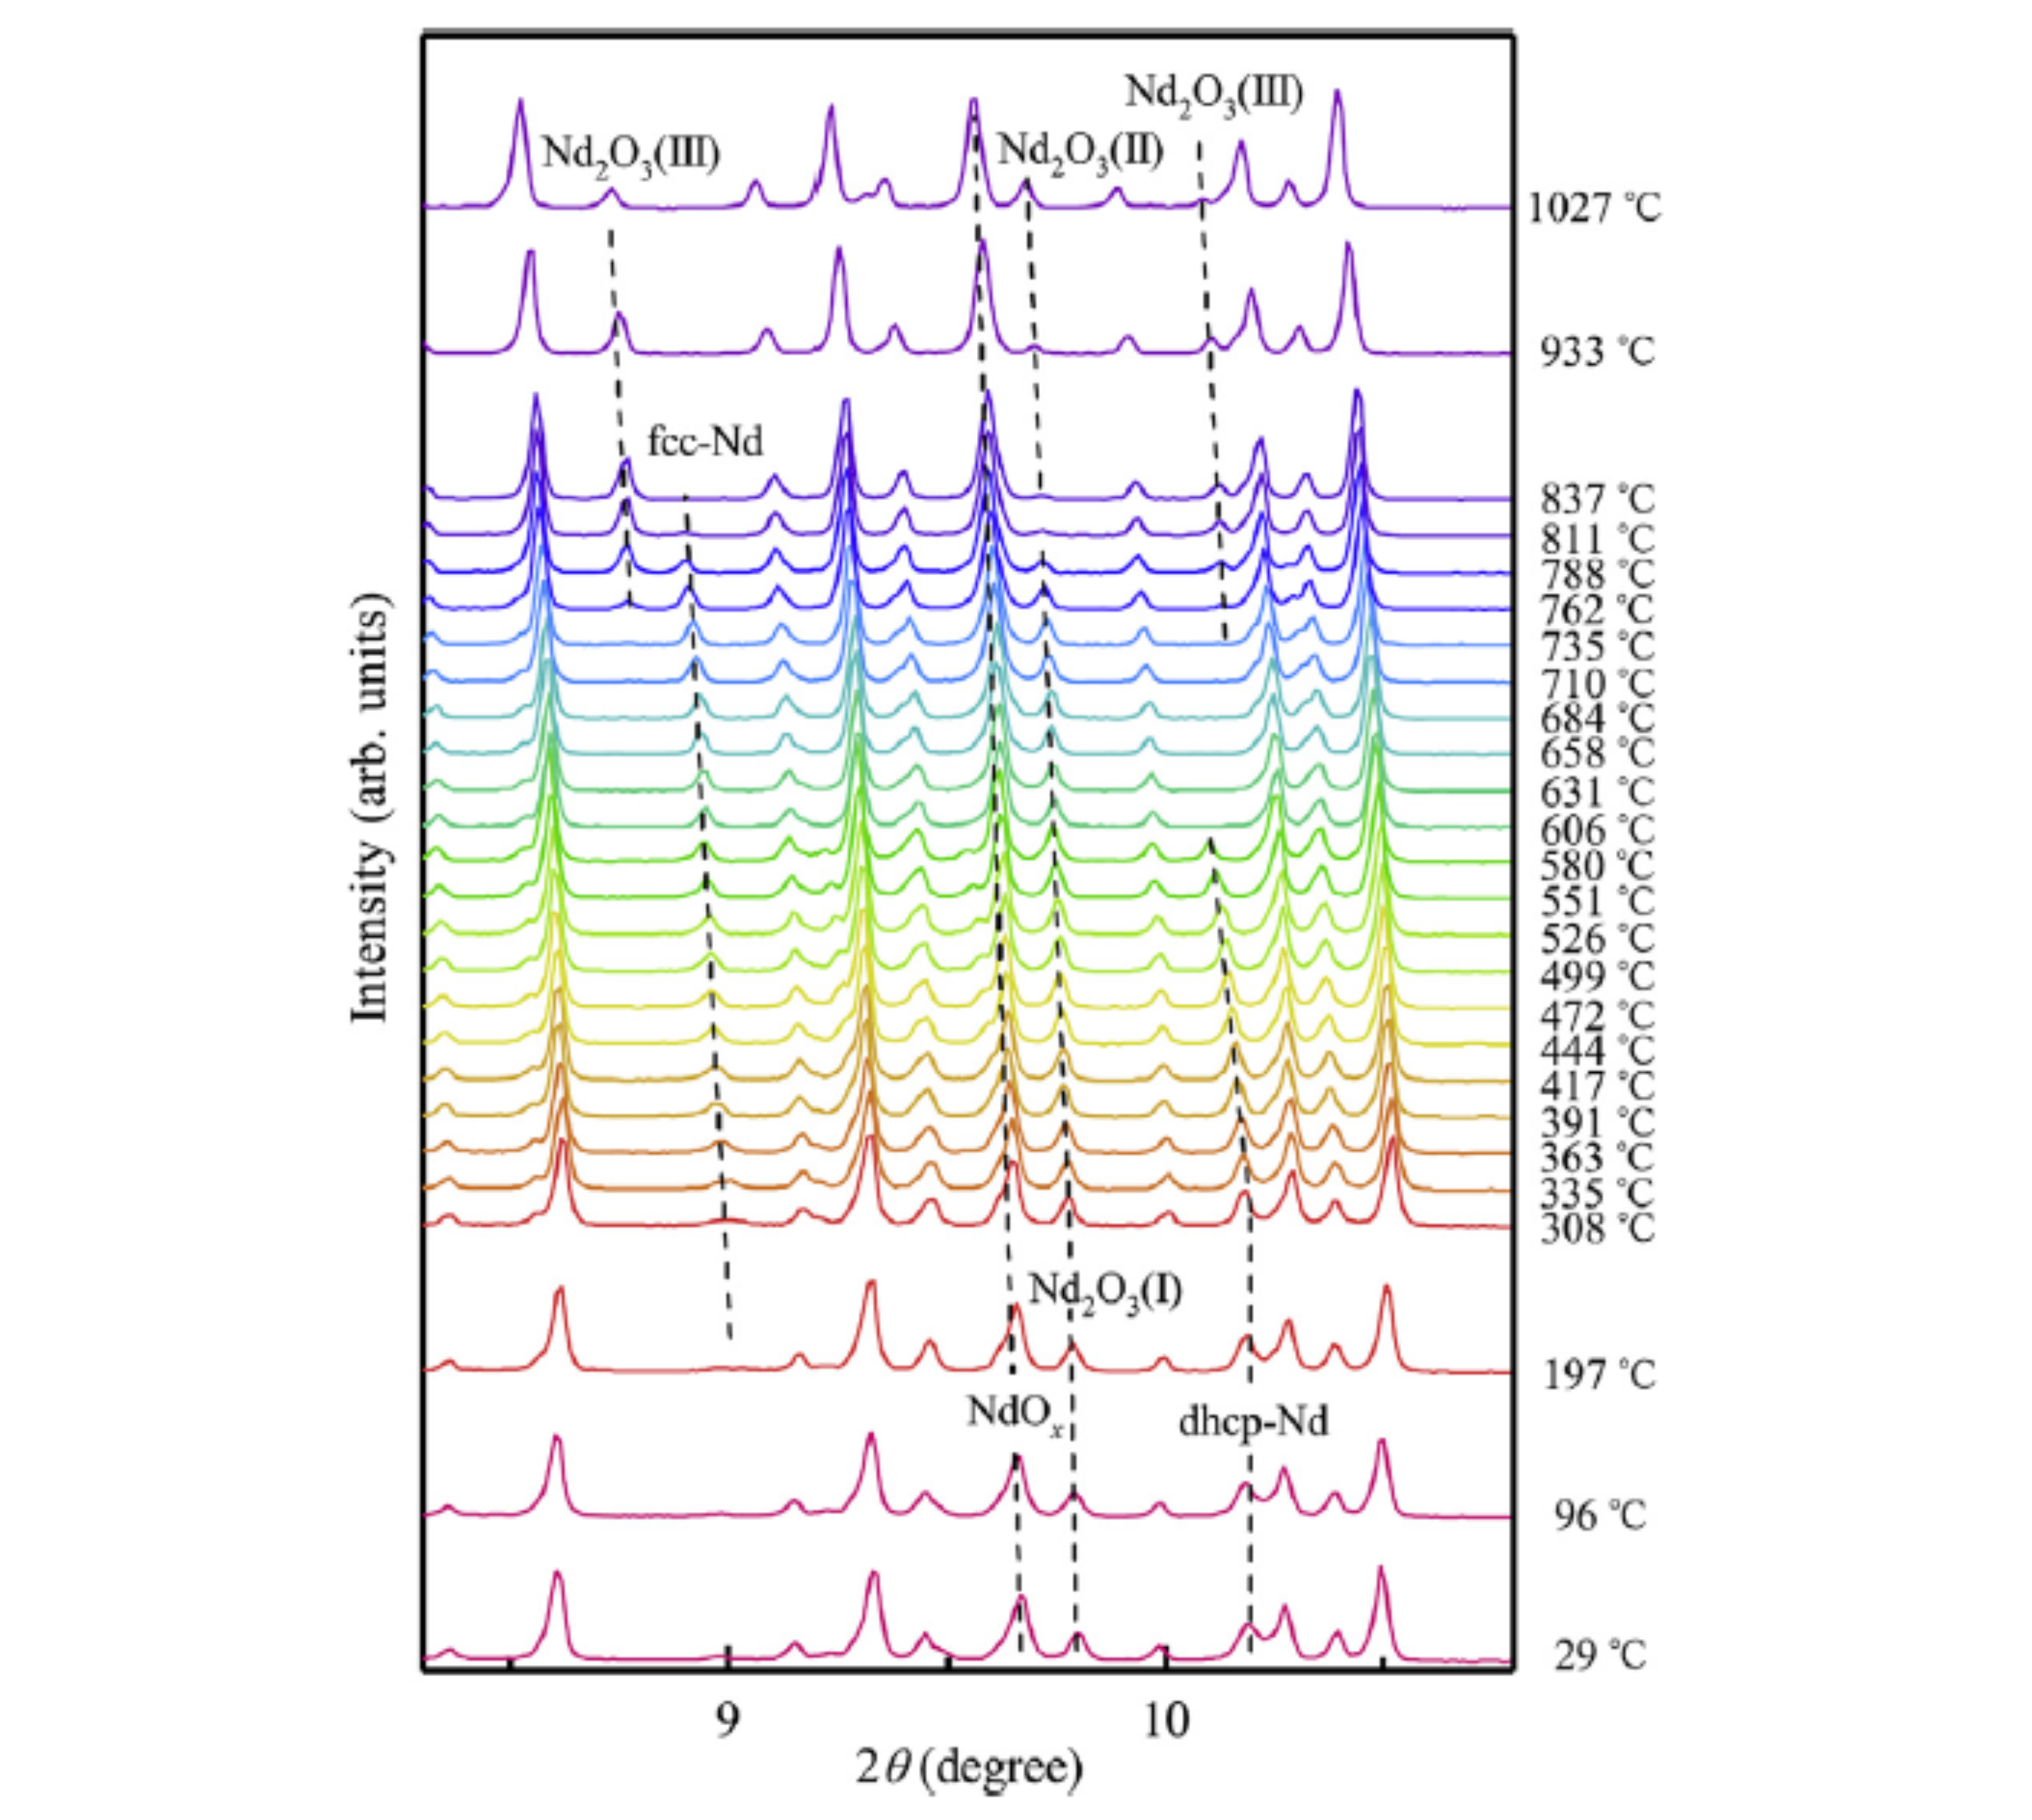
Tsuji et al. [2018Tsu] investigated the constituent phases of a sintered magnet with the nominal composition of Fe-14.2Nd-6.3B-0.1Cu (at.%) at ambient and elevated temperatures. Figure 9 (Figure 2 from [2018Tsu]) shows the in-situ XRD data of this sintered magnet from room temperature up to 1027 °C. In addition to the majority T1 phase, other phases observed include fcc-Nd, dhcp-Nd, NdOx, and three types of Nd2O3 phases. Oxides were observed due to the contamination of the sample with oxygen. The dhcp-Nd phase disappears at about 600 °C and the NdOx phase is stable in the entire measured temperature range. The three types of Nd2O3 phase were also observed within different temperature ranges.
The experimental observations of Tsuji et al. [2018Tsu] can be well understood by using the PanMag database. A lever rule solidification calculation was performed for an alloy at the composition of Fe-14.2Nd-6.3B-0.1Cu-0.1O (at.%) as shown in Figure 10. As is seen, Fcc phase solidifies from liquid phase first and transfers to T1 phase at high temperature through a peritectic reaction. T2 phase forms at 1041 °C, and Nd2O3 phase forms at 1033 °C. The NdO phase starts to form at 976 °C and Hcp phase starts to form at 686 °C. The calculated phase forming sequence is listed inTable 5 and it is in reasonable agreement with the experimental observation. The experimentally observed fcc-Nd phase at low temperatures may correspond to the un-dissolved fcc phase formed at higher temperatures as predicted by our simulation. Note that the fcc phase at high temperature is Fe-rich phase. The other discrepancy is that the T2 phase is stable at the temperature range below 1041 °C according to our calculation, but not observed in the experimental results. This may be due to the low percentage of the T2 phase.
In addition to the microstructure information, the magnetic properties of T1 phase are calculated for this alloy at room temperature. The Curie temperature TC is calculated to be 585K, the saturation magnetization BS is 1.6 T and the magnetocrystalline anisotropy field HA is 73 kOe.

b) Alloys Fe-12.6Nd-1.4Dy-8B and Fe-12.6Nd-1.4Dy-1.4Al-8-B (at.%)
The replacement of a small amount of Fe with Al may increase the coercivity of the RE2Fe14B phase by up to 50%. Substitution of Fe with Al increases the c/a ratio of the T1 phase, which is believed to weaken the exchange interaction between Fe atoms along the c direction and result in the decrease of domain wall thickness. A lower domain wall thickness can lead to larger nucleation fields or coercivities through domain wall pinning.
The effect of Al on the coercivity of Nd-Dy-Fe(Al)B magnets was investigated by Strzeszewski et al. [1988Str]. The samples were vacuum sintered for 1 to 2 hours at 1050-1120 °C, heat-treated at 900 °C for 1 hour and annealed at 550-650 °C for 1 hour. Three phases, T1, T2 and Nd-rich phase, were identified for both alloys Fe-12.6Nd-1.4Dy-8B and Fe-12.6Nd-1.4Dy-1.4Al-8B (at.%). Experimental results also showed clearly that Al goes in the matrix T1 phase.
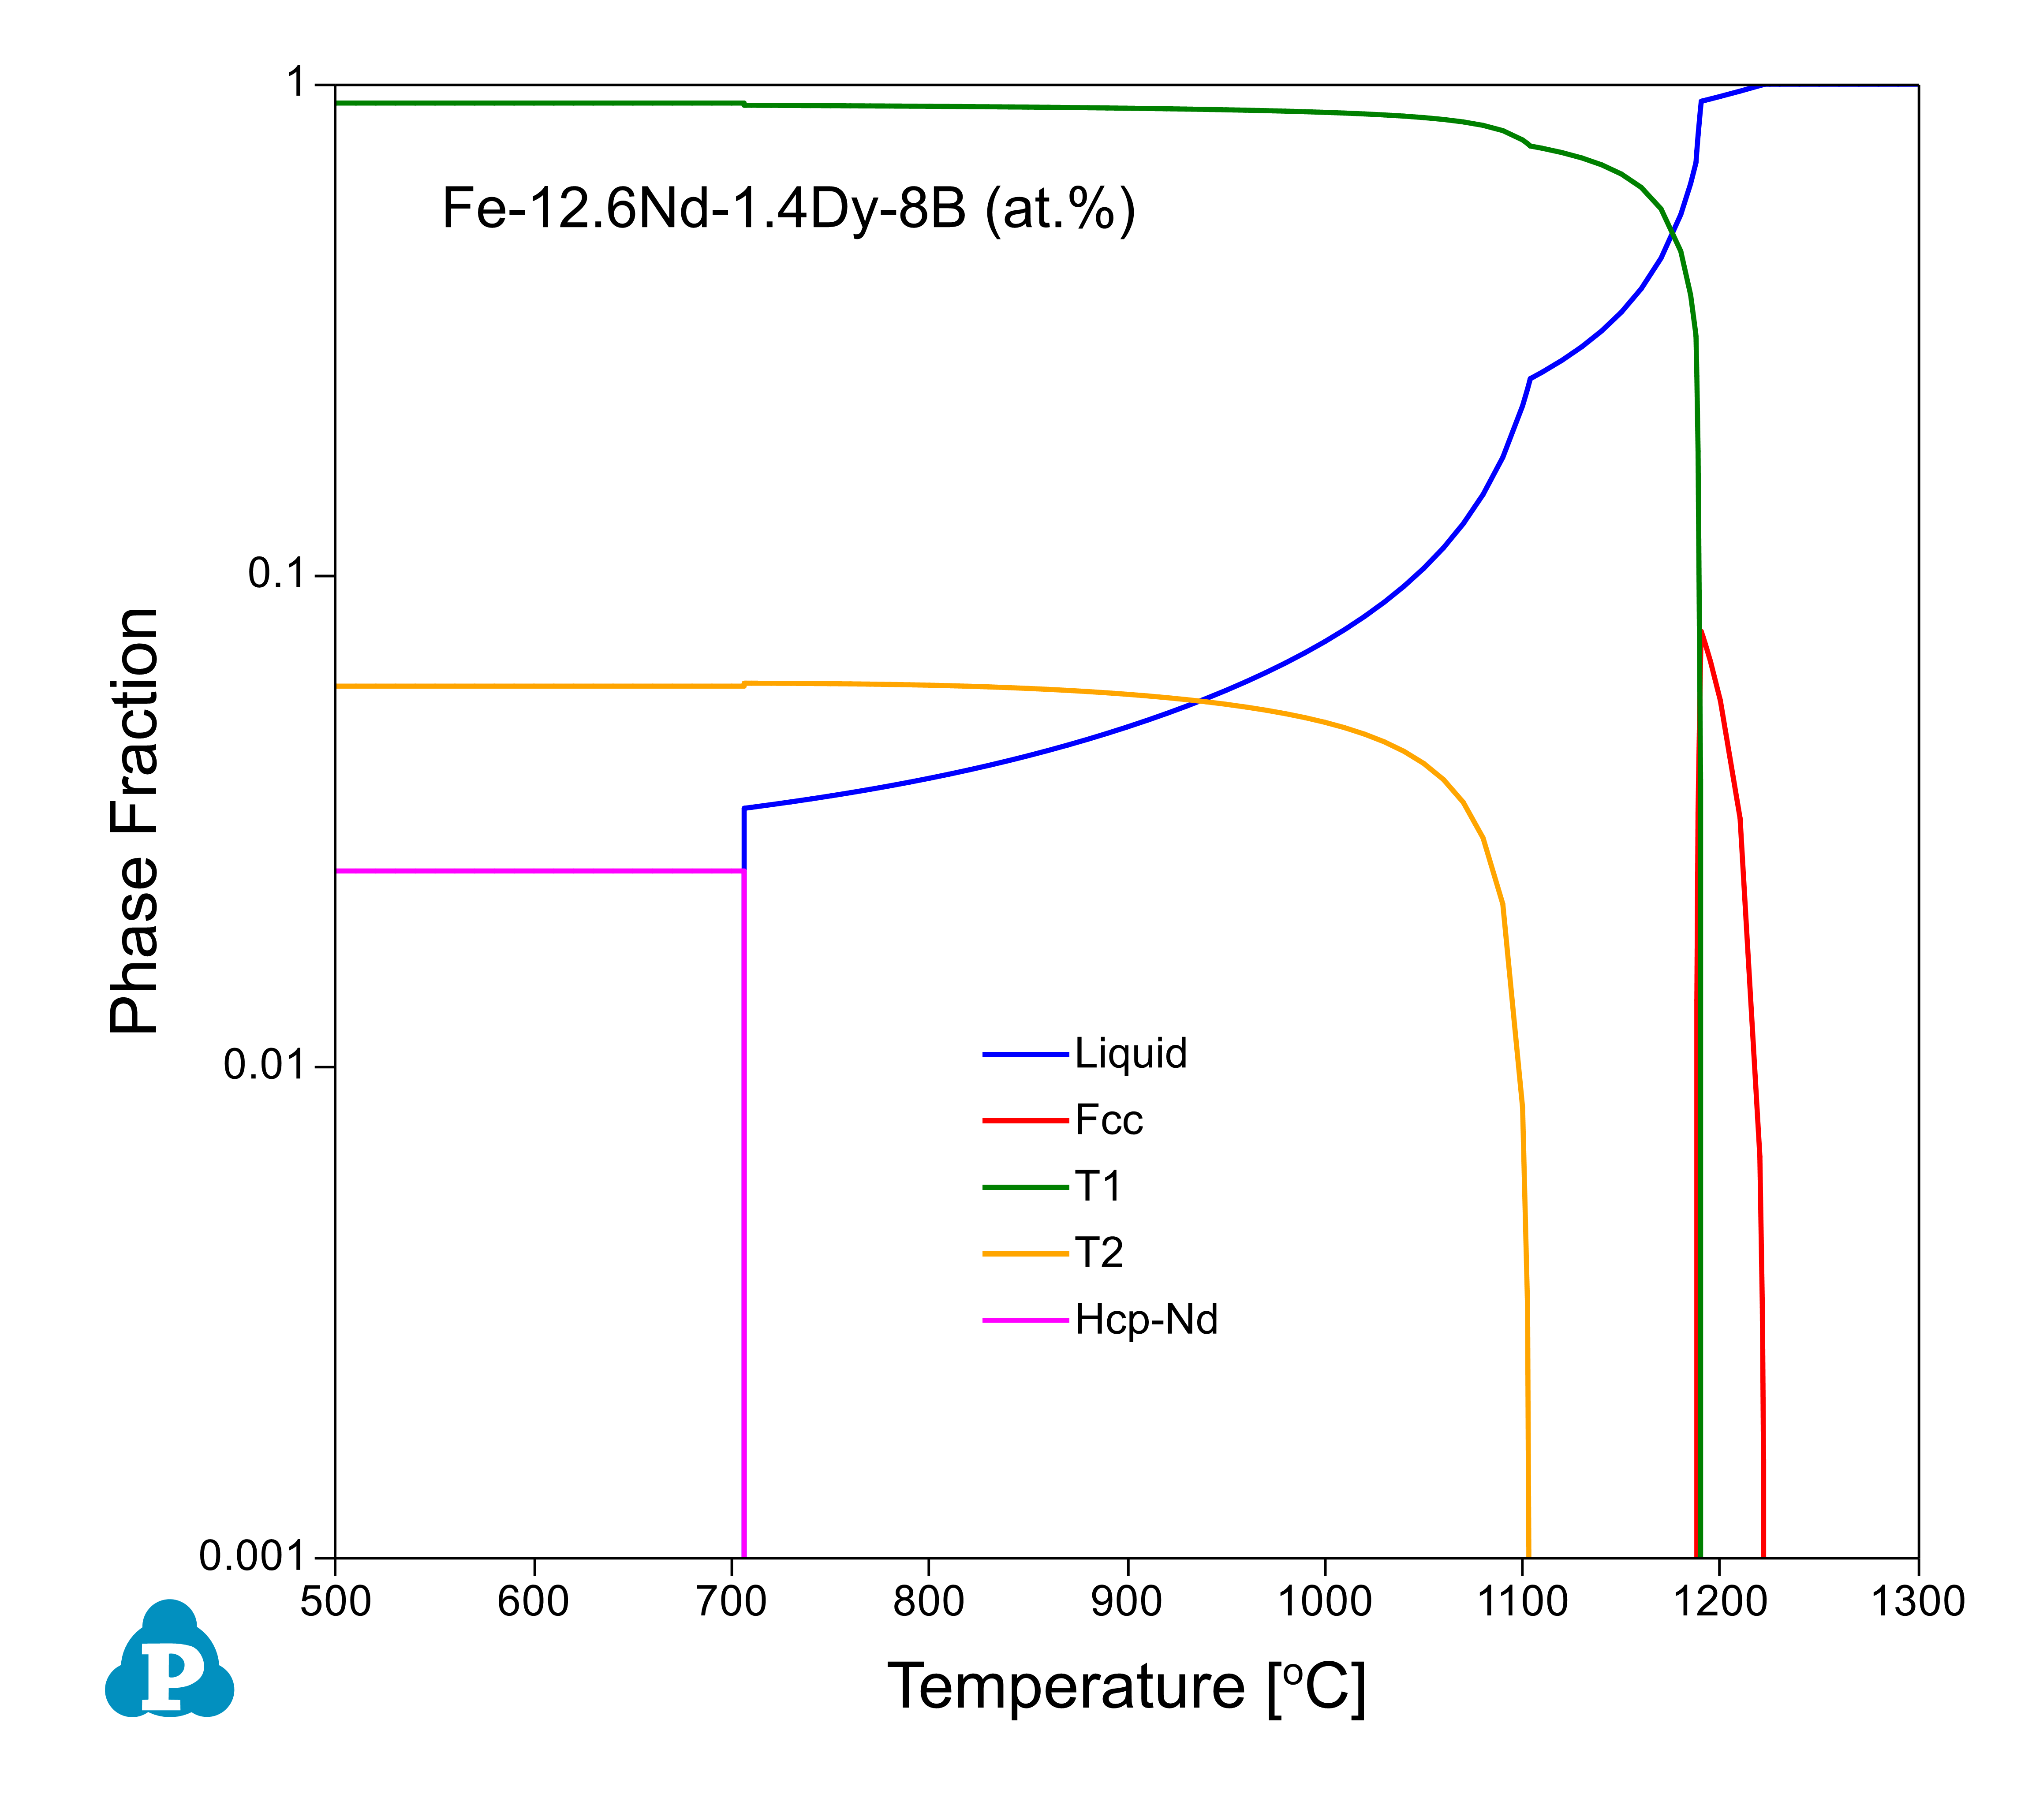
Here we use PanMag to simulate the effect of Al on the Nd-Dy-Fe(Al)B magnets. First, a lever rule solidification calculation was performed for alloy Fe-12.6Nd-1.4Dy-8B (at.%) as shown in Figure 11. As is seen, the Fcc phase first solidifies from liquid phase, T1 phase starts to form at 1190 °C and T2 phase starts to form at 1104 °C. The liquid phase disappears at 706 °C due to the reaction of  . T2 phase and Hcp phase remain stable at low temperatures.
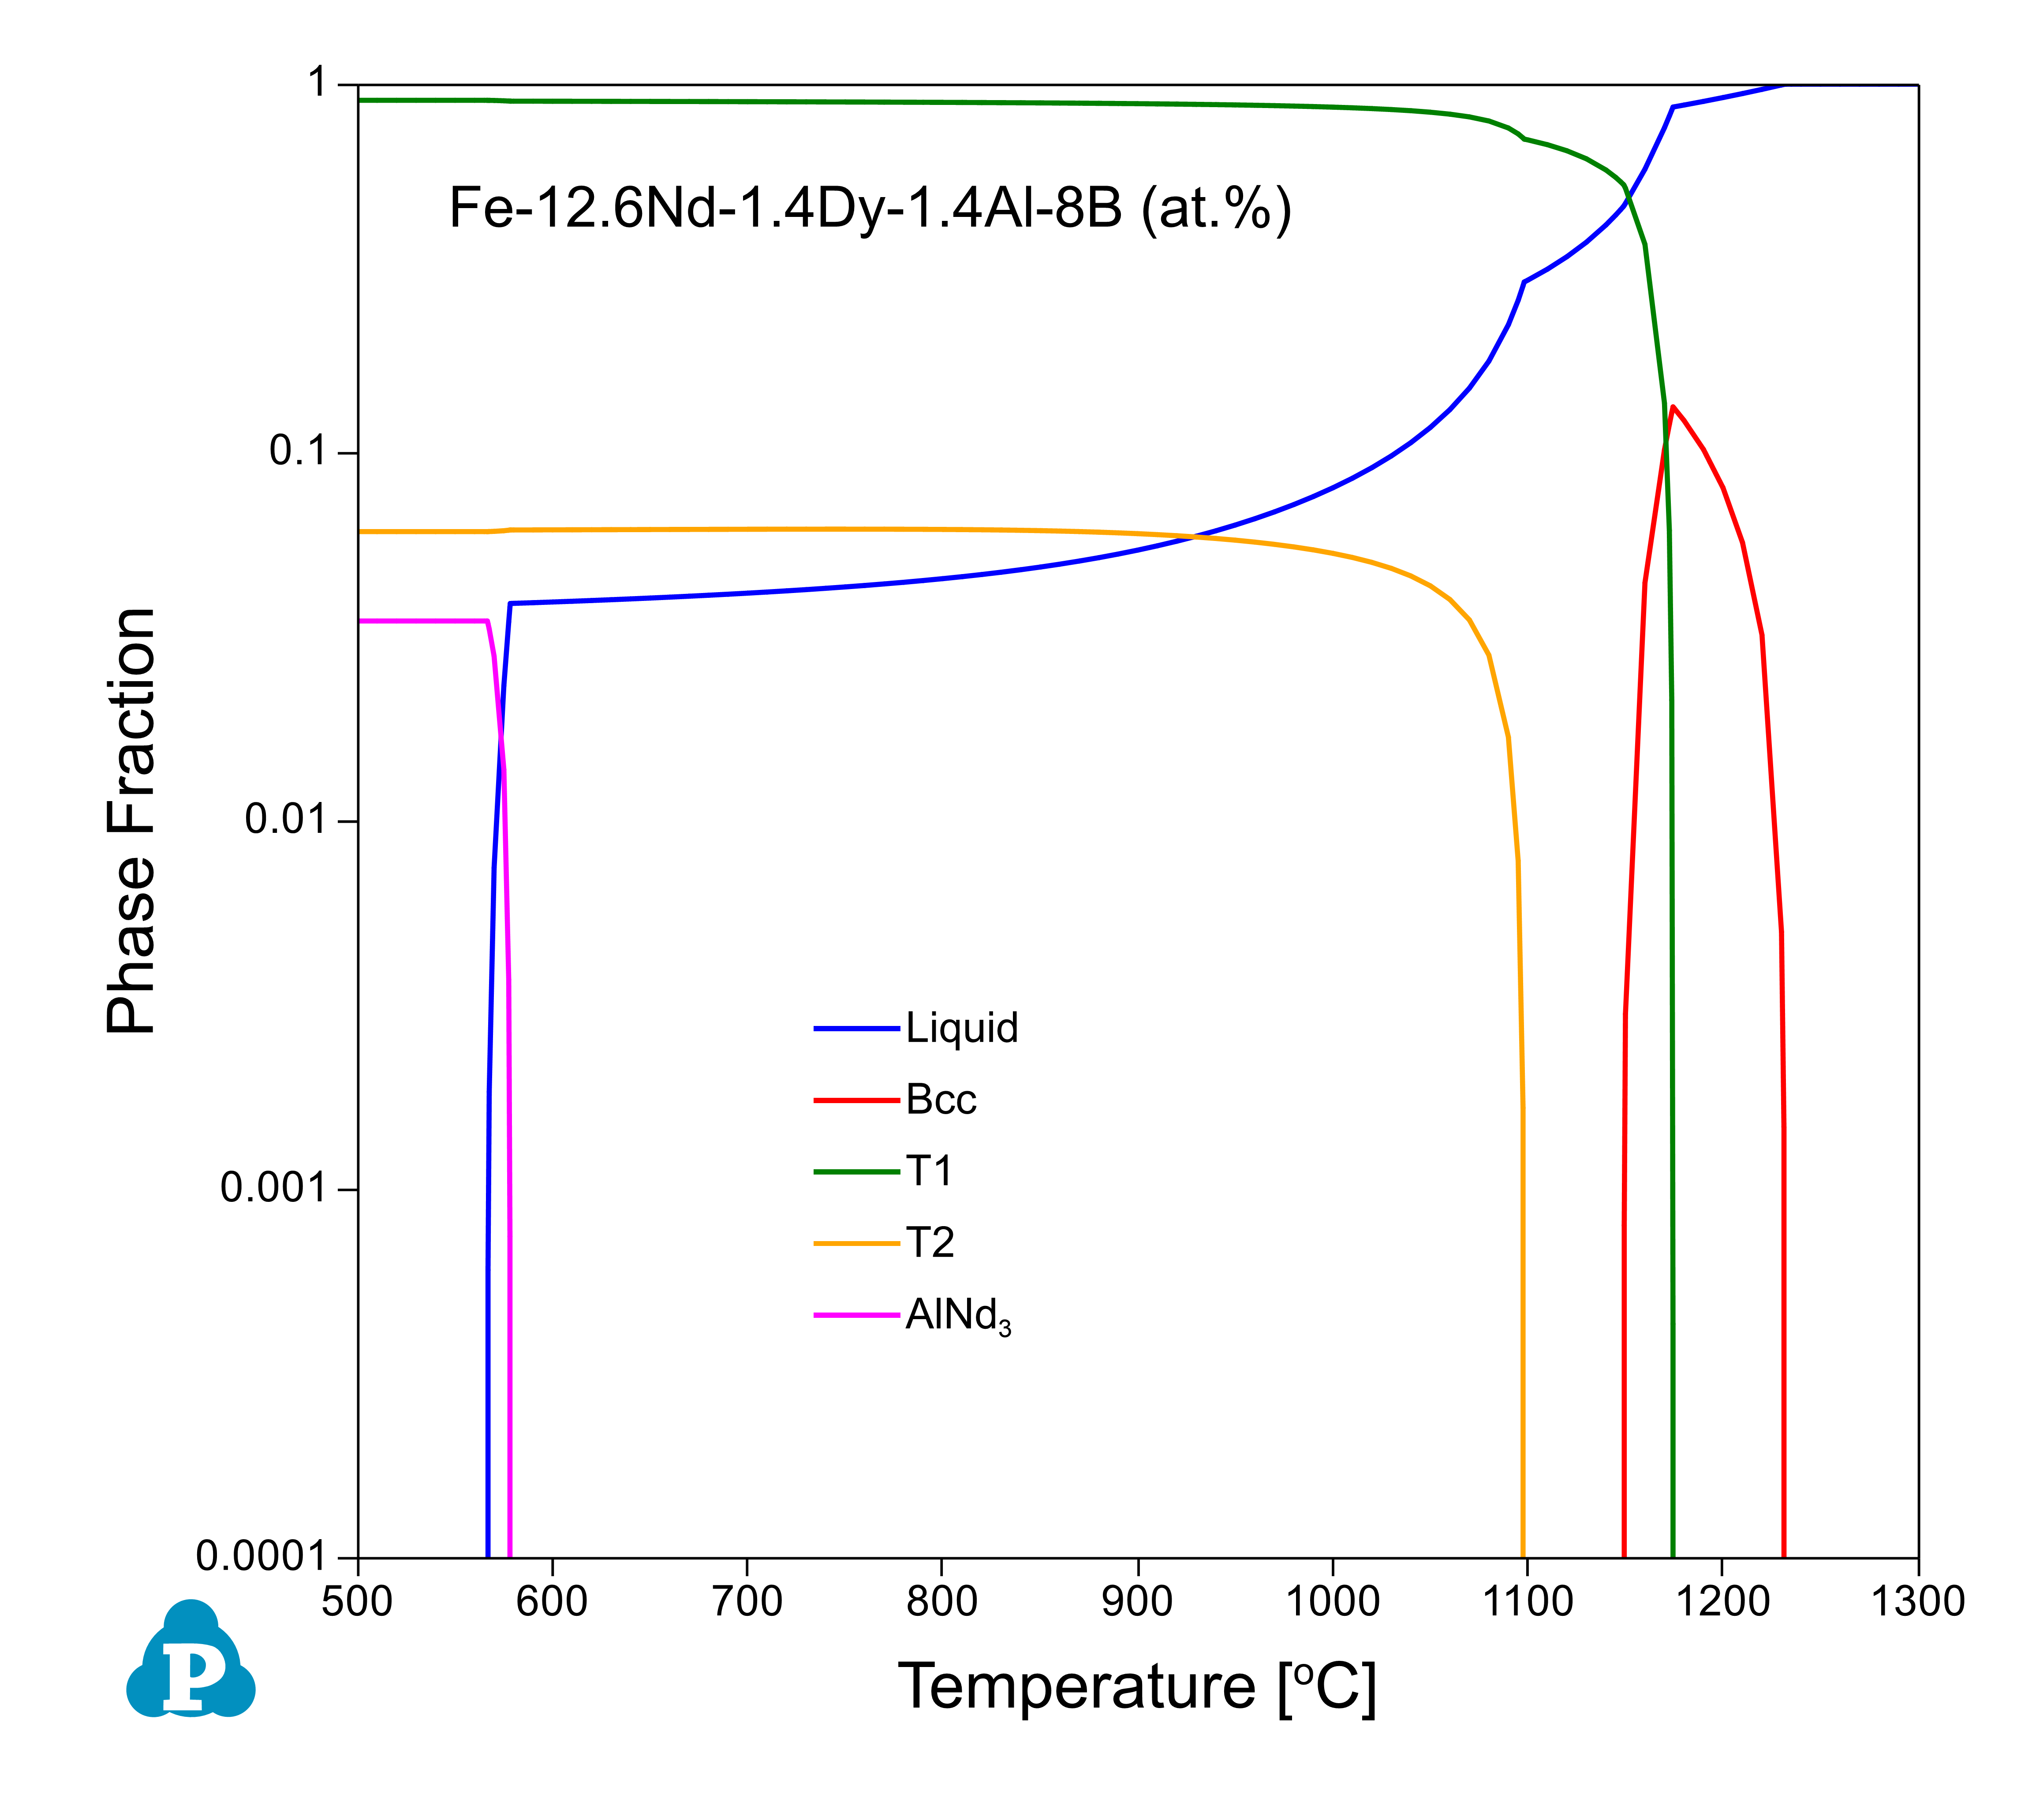
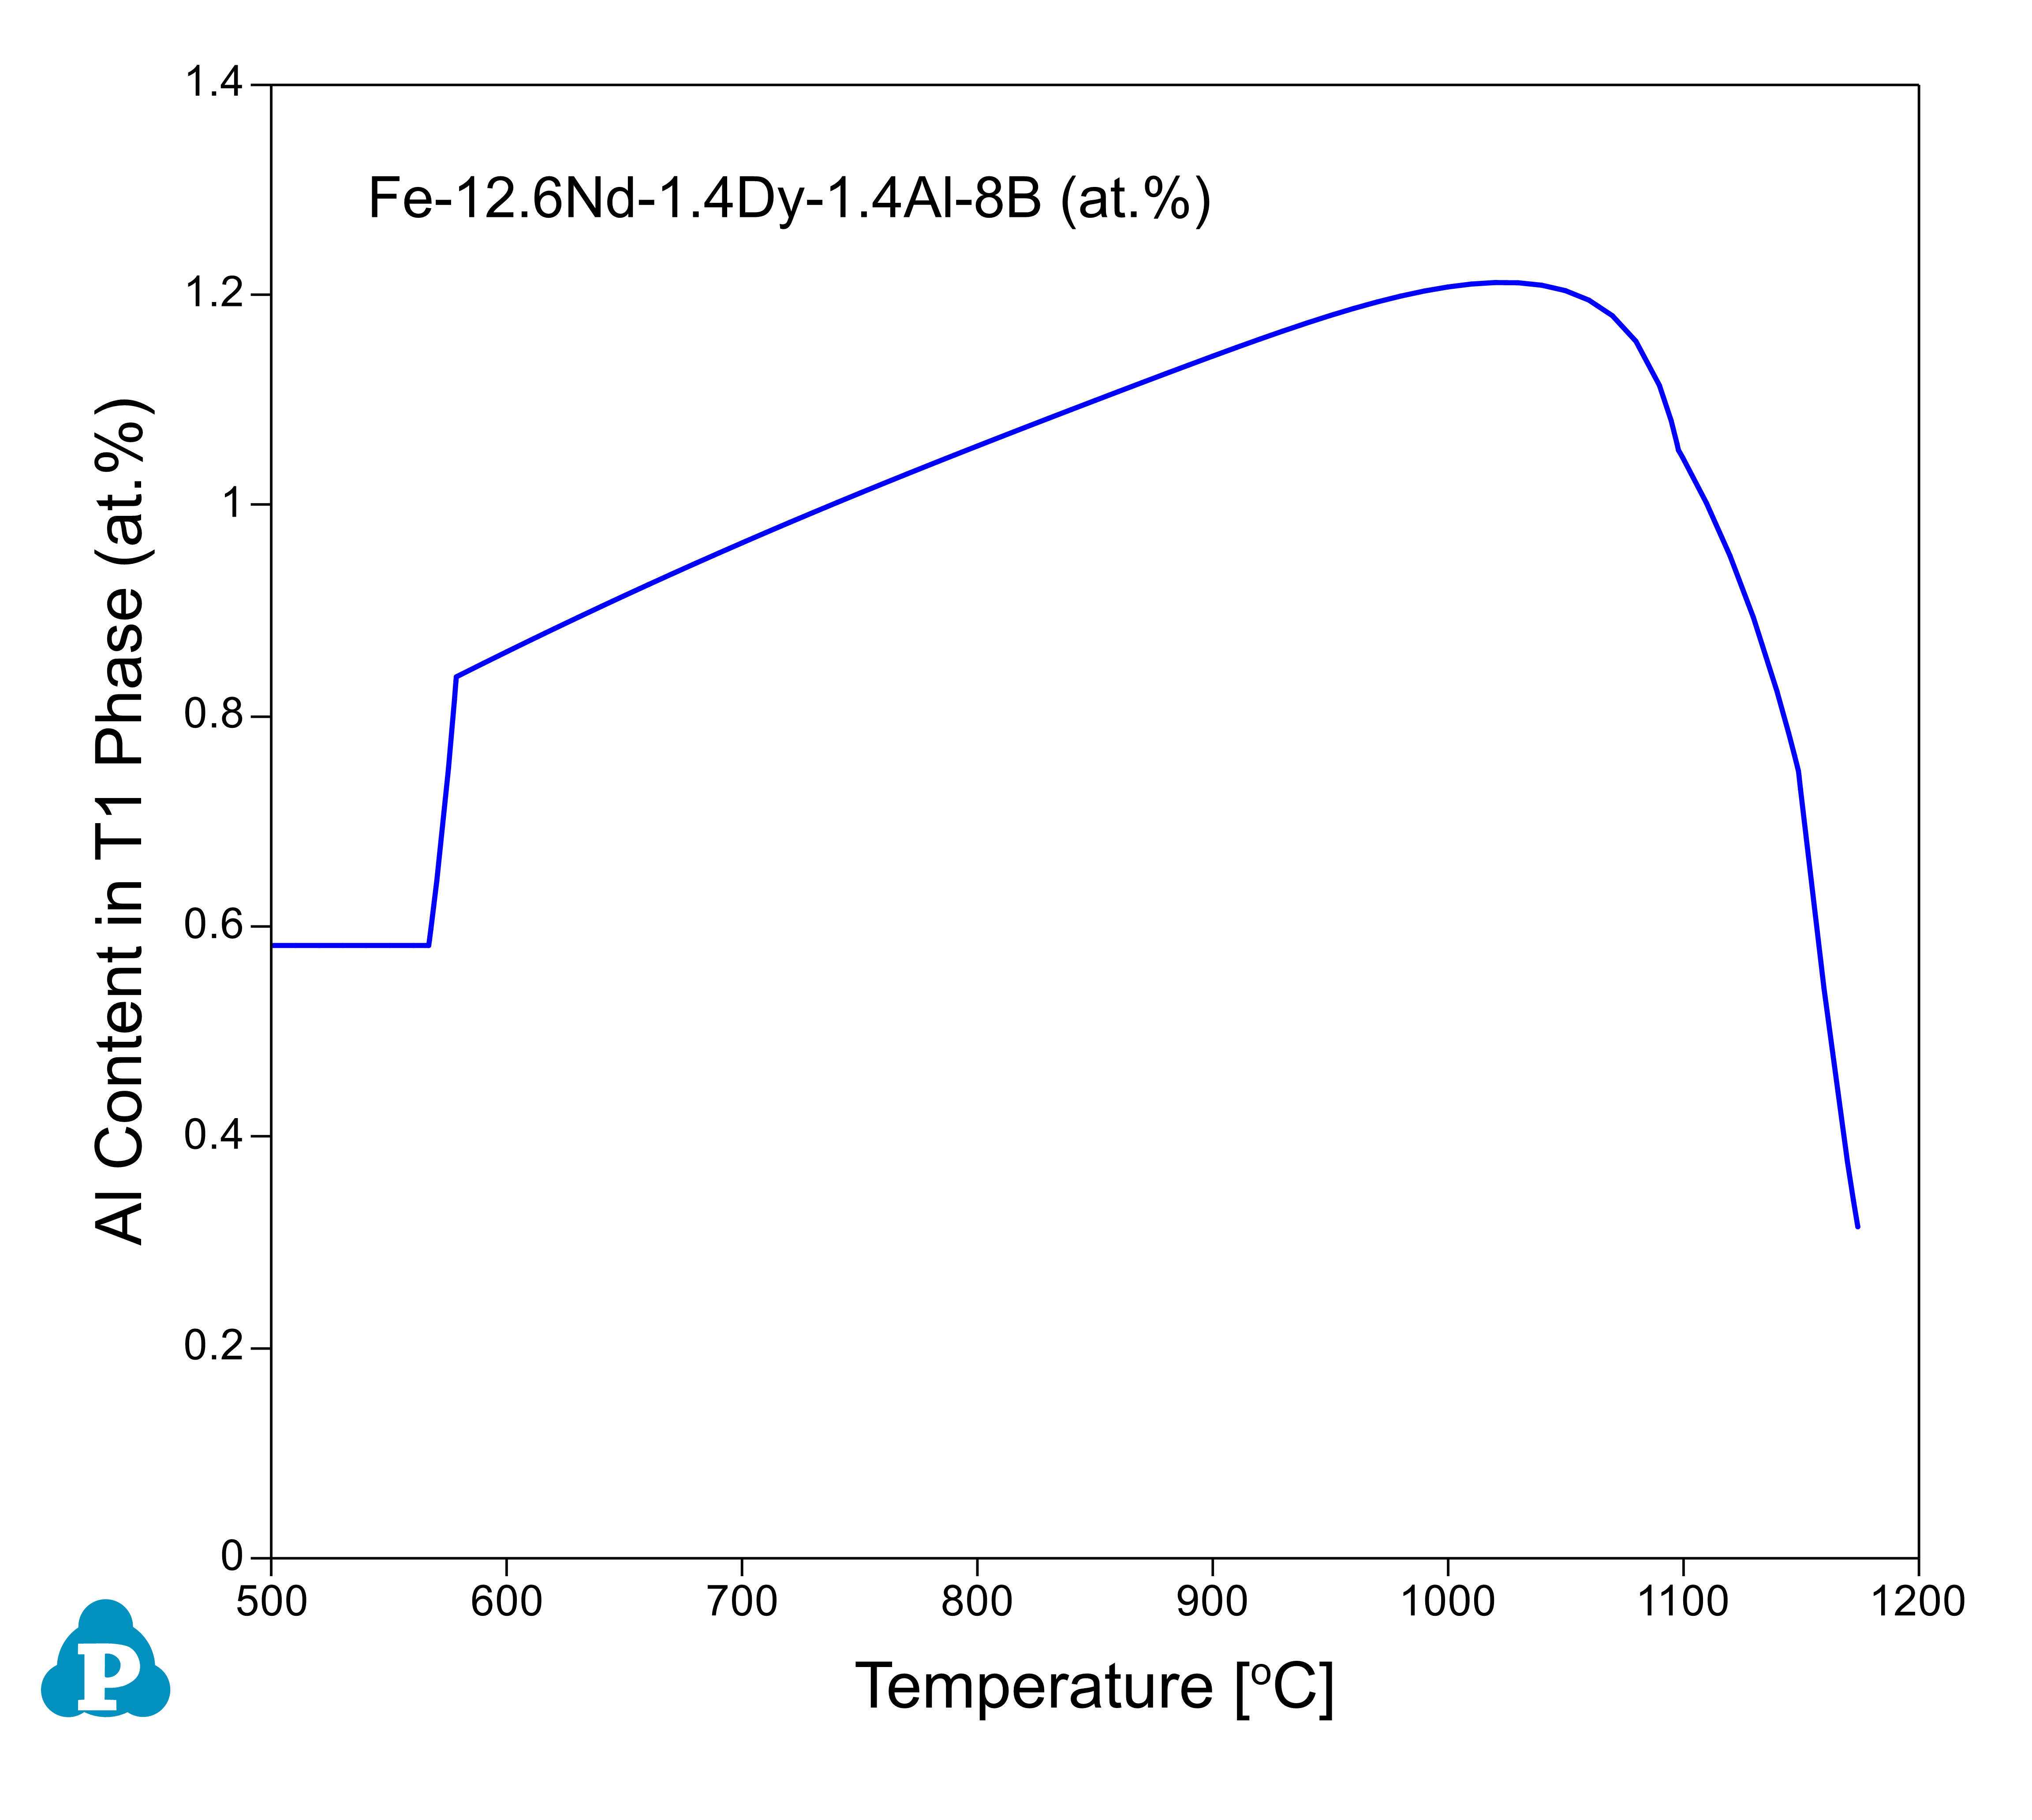
Then, lever rule simulation was performed for another alloy by replacing 1.4 at% Fe with Al. As shown in Figure 12, with 1.4 at.% of Al addition, Bcc phase first solidifies from liquid phase and T1 phase and T2 phase start to form at a slightly lower temperatures, 1174 °C and 1098 °C, respectively. The liquid phase disappears at 567 °C due to the formation of AlNd3 phase. This temperature is 139 °C lower than that of the alloy without Al addition, which is beneficial for better microstructure and magnetic property. In this calculation, the Al content in T1 phase reaches maximum of ~1.21 at.% at 1030 °C and decreases at lower temperatures due to the forming of AlNd3 with high Al content (Figure 13). T2 phase has no Al solubility. Table 6 summaries the calculated results, which are consistent with the experimental observations.
In addition to the microstructure, the magnetic properties are also calculated for the two alloys. For the alloy without Al, the Curie temperature TC of T1 phase is 600K, saturation magnetization BS is 1.486 T and magnetocrystalline anisotropy field HA is 83.91 kOe at room temperature, respectively. With the addition of Al, the properties of T1 phase change to 600K, 1.458 T and 83.83 kOe, very close to the properties without Al addition. This is due to the low Al content in T1 phase at room temperature. However, addition of small amount of Al helps to decrease the melting temperature which is beneficial to the development of desired microstructure. In addition, Al helps to change the c/a ratio which can potentially increase the coercivity.
c) Fe-13.5Nd-0.2Pr-0.2Dy-0.2Tb-6.6B-0.1Cu-0.5Al-0.4Ni-1.8Co-0.5O (at.%)
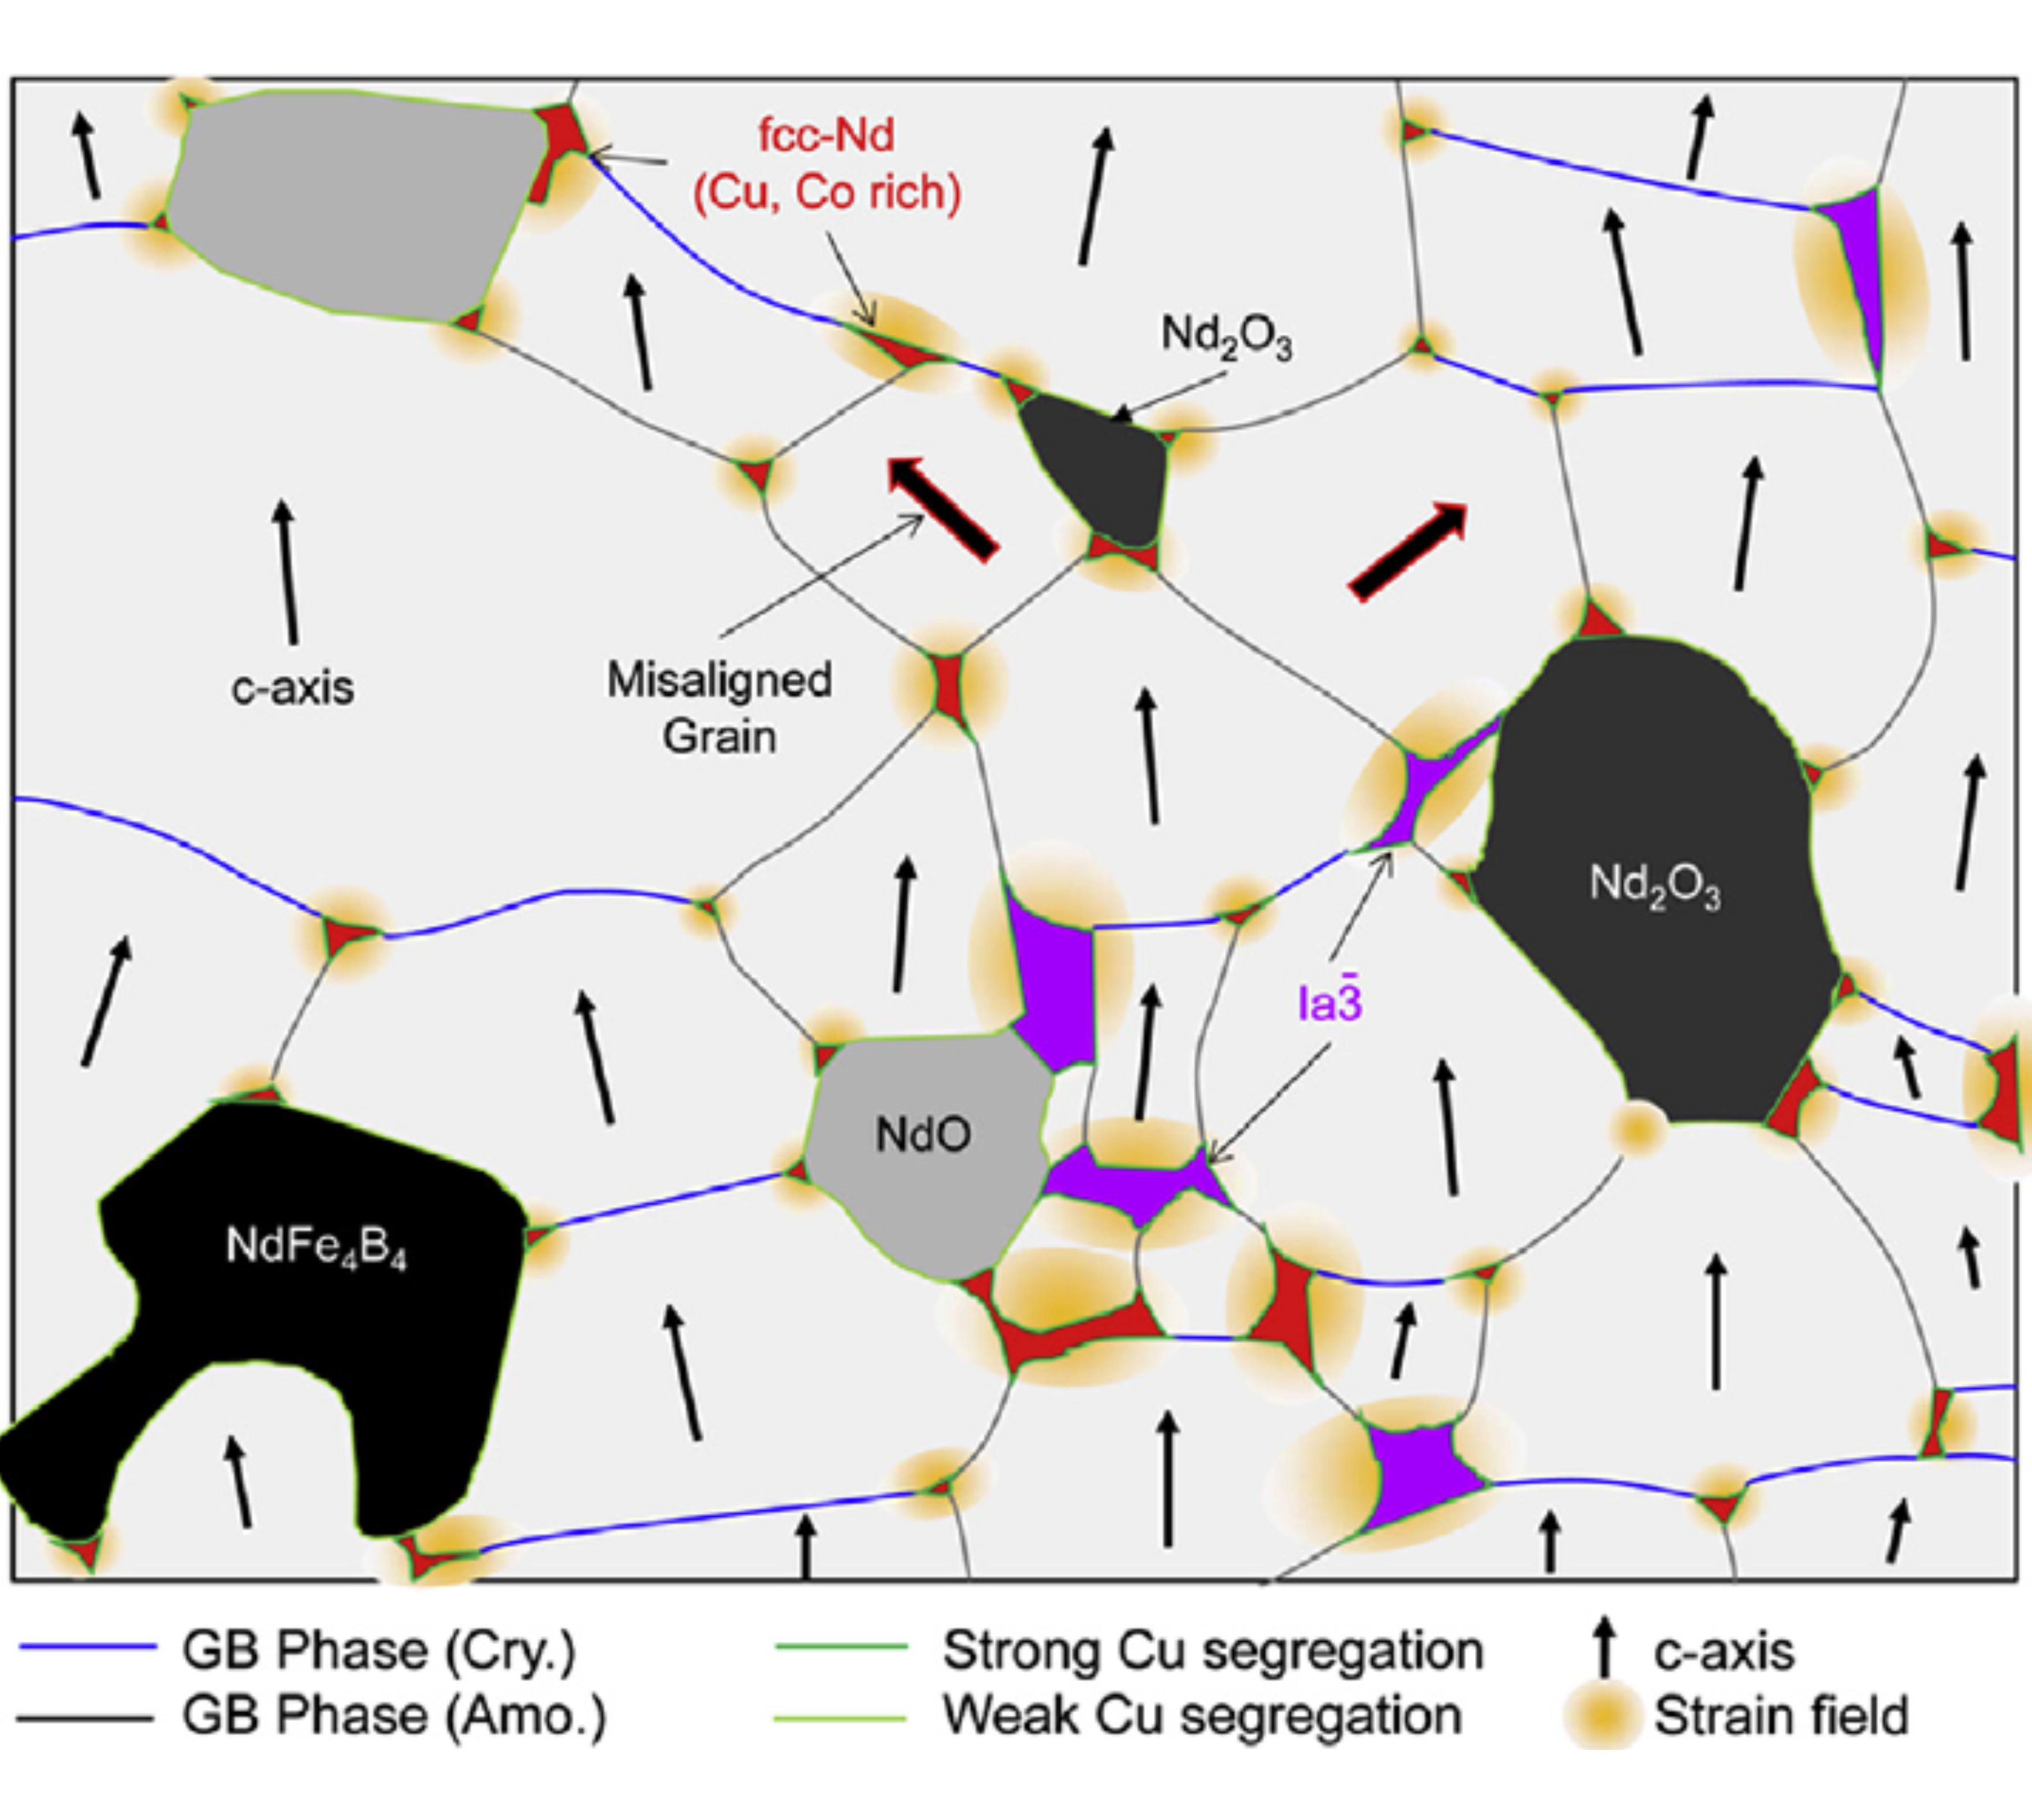
Sasaki et al. [2016Sas] revisited the microstructure of a commercial Nd-Fe-B sintered magnet (Fe-13.5Nd-0.2Pr-0.2Dy-0.2Tb-6.6B-0.1Cu-0.5Al-0.4Ni-1.8Co-0.5O in at.%) using scanning electron microscopy (SEM) and aberration corrected scanning transmission electron microscopy (STEM). Five phases were observed at grain boundary triple junctions as shown in Figure 14 (Figure 11 in [2016Sas]): Fcc-NdOx (Fm-3m, NaCl type), Hcp-Nd2O3 (P-3ml, La2O3 type), Fcc-Nd phase (Nd73Fe3Co13Cu11), Nd-rich phase (Ia-3, Mn2O3 type, Nd92.6Fe2.5Co0.7Cu4.2 ) and T2 phase (NdFe4B4).
Although Sasaki et al. did not specify the heat treatment detail of the magnet, a typical liquid sintering process is assumed as follows: magnetically aligned single crystalline fine particles are isostatically pressured to make a green compact followed by liquid sintering at an elevated temperature of ~950–1100 °C and then annealed at 520-600 °C to improve coercivity.
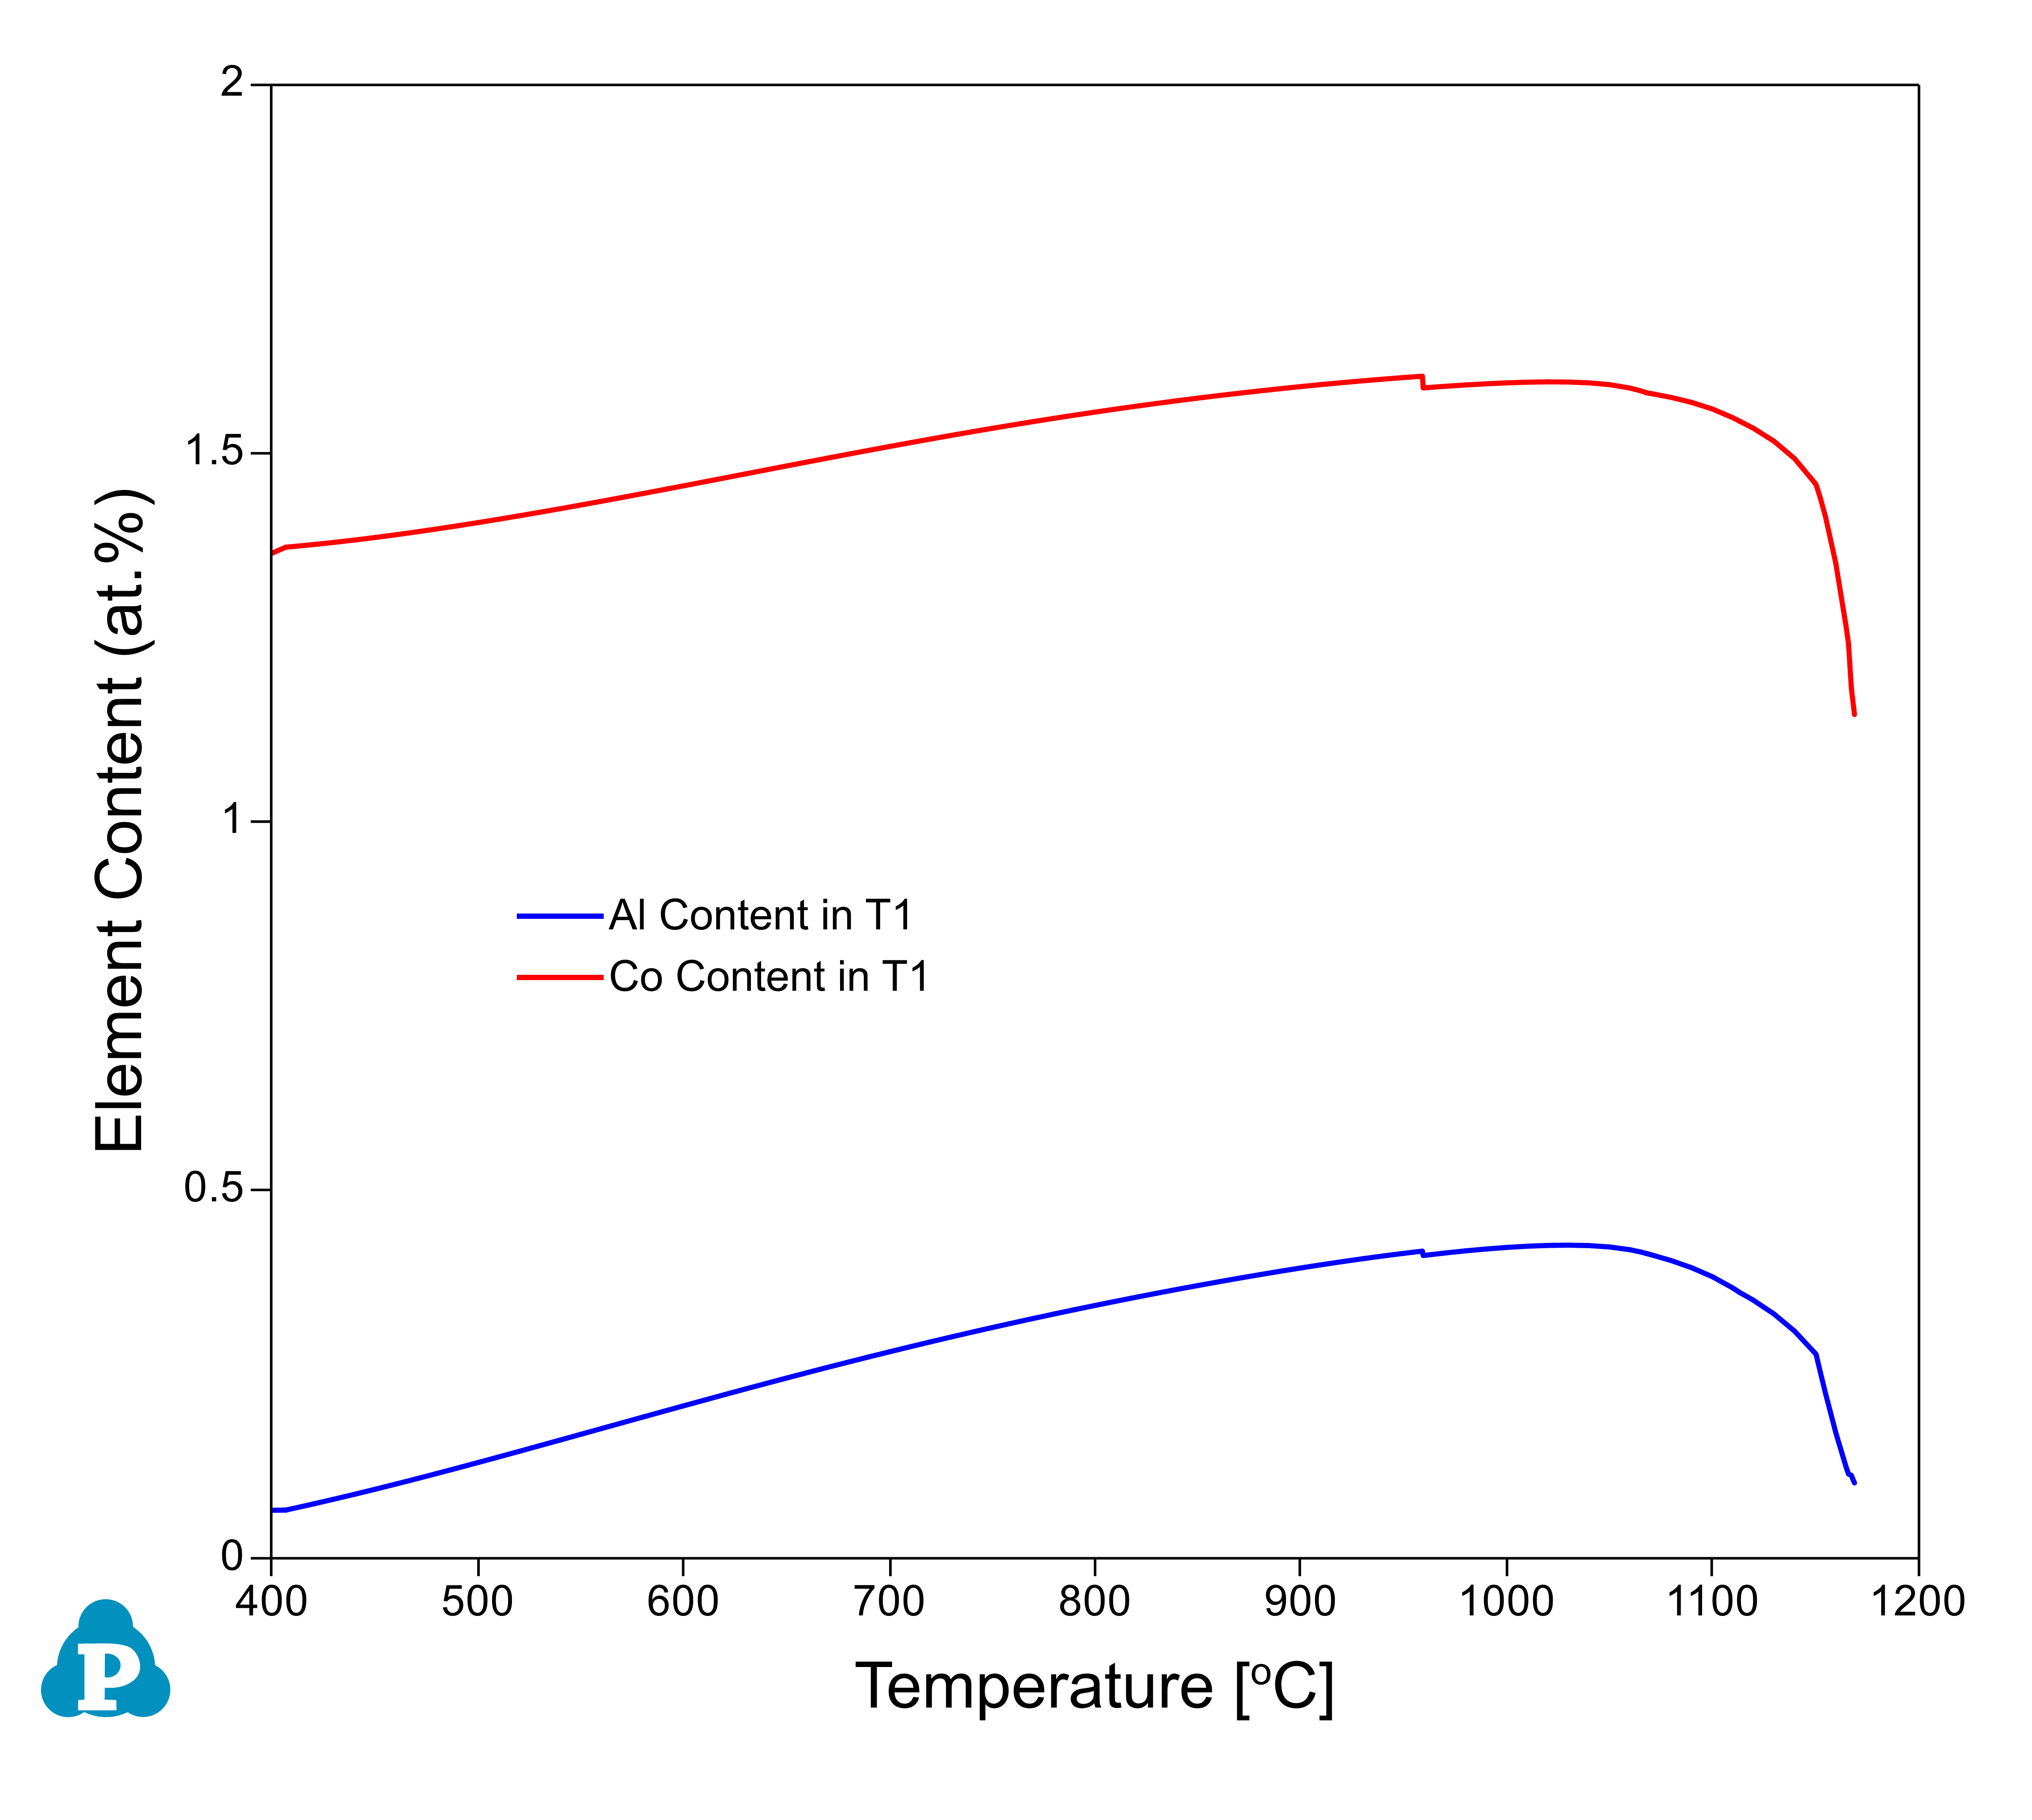
A lever rule simulation was performed for alloy Fe-13.5Nd-0.2Pr-0.2Dy-0.2Tb-6.6B-0.1Cu-0.5Al-1.8Co-0.5O (at.%) as shown in Figure 15. In this simulation, the 0.4 at% Ni was replaced by Fe since Ni is not included in the PanMag database. According to the calculation, the phase fractions of the oxides directly formed from solidification are quite low (Nd2O3 less than 1%, NdO 1%). The Nd-rich liquid phase (3.4% in lever rule calculation at 400 °C) probably was further oxidized with a small amount of metal left. The contents of both Al and Co reach maximum in T1 phase at ~1030 °C (0.43 at.% for Al and 1.6 at.% for Co) and then drop with decreasing temperature as shown in Figure 16. The simulated results are compared with the experimental data as listed in Table 7. The solidified phases from the simulation are in general agreement with those observed by Sasaki et al. [2016Sas].
In addition, the magnetic properties are also calculated for this alloy at room temperature. The Curie temperature TC of T1 phase is 602 K, saturation magnetization BS is 1.576 T and magnetocrystalline anisotropy field HA is 78.54 kOe, respectively.

d) Fe-11.6Nd-3.7Pr-5.1B-0.1Cu-1.0Co-0.9Al-0.1/0.5Ga (at.%)
Ga has been known to improve the wettability of the Nd-rich phase and increase the coercivity due to the formation of the Nd6Fe13Ga phase at grain boundary.
Sasaki et al. [2016Sas2] characterized the microstructure of the Ga-doped Nd-Fe-B magnet sintered at 1030 °C for 3h and then annealed at 480 °C for 1h with the alloy composition: Fe-11.6Nd-3.7Pr-5.1B-0.1Cu-1.0Co-0.9Al-0.5Ga (at.%). In addition to Fcc-NdOx phase, three more phases were observed in the grain boundary: (1) amorphous phase with composition Fe10.7RE63.3Ga15.7Cu10.3; (2) Fe58.9RE33Ga5.4Cu2.7, which is close to the Nd6Fe13Ga phase; (3) Fe1.8RE92Ga0.6Cu5.7 (all in at.%).
Table 8 shows the difference between the calculated results and the experimental observation. About 0.5 at.% of O was added in the alloy composition with Fe being the balancing element for the calculation, which is similar to the commercial alloy in the previous example. The calculated fractions of T1 and NdO are very close to the experimental observations. The calculated Nd6Fe13Ga phase fraction is higher than that from experimental observation, which suggests that longer annealing time may be necessary in order to obtain the microstructure with more beneficial Nd6Fe13Ga phase in grain boundary.
In addition, the magnetic properties are also calculated for this alloy at room temperature. The Curie temperature TC of T1 phase is 588 K, saturation magnetization BS is 1.566 T and magnetocrystalline anisotropy field HA is 74.26 kOe, respectively.
Xu et al. [2018Xu] investigated the microstructure of two sintered magnets with 0.1 and 0.5 at.% Ga, respectively. These two magnets were sintered at 900 °C for 10h and then subjected to two-step annealing at 820 °C for 3h and 490 °C for 4h. Four different Nd-rich phases were found at the GB triple junctions for the sample with 0.1Ga:
-
Fcc-NdOx, with composition of (Nd,Pr)80.6O14.4(Fe,Co)1.6Cu1Al2.1Ga0.3
-
Amorphous phase with the approximate chemical composition of (Nd,Pr)74Ga11.3Al7.2(Fe,Co)1.6Cu0.8O5.1
-
Fcc structure, with composition of (Nd,Pr)62.4(Fe,Co)15.7Cu8.8Ga5.1Al2.6O5.4
-
DHCP - (Nd,Pr)88.5(Fe,Co)2.3Cu1.2Ga0.4Al2.3O5.3. This phase induces partial melting of the Nd-rich phases during post sinter annealing in the temperature range from 520 to 650 °C due to the Nd-Cu and Nd-Fe-Cu eutectic reactions. Thus, the Nd-rich triple junction phase can serve as a pumping source for the formation of intergranular GB phase.
The Nd6Fe13Ga phase is observed to distribute at the GB triple junctions in the sample containing 0.5Ga, which was not observed in the sample with 0.1Ga. Xu et al. [2018Xu] also indicated that the Cu and Ga have rather low solubility within the matrix T1 phase. About 0.6 and 1.1 at.% of Co and Al are dissolved into the matrix phase suggesting a partial substitution of Fe atoms by Al.
The experimental observations are much more complicated than the calculated results (about 0.5 at.% of O is assumed in the calculation) as shown in Table 9. The average thickness varies from 1.5nm to 3.0nm for the GB phases, which may cause the deviation from the bulk calculation.
Note: All the phases at the GB triple junctions have O content being 5 at.% or higher.
e) Summary
The ultimate performance of coercivity and its thermal stability is expected in a magnet with maximized anisotropy factor α and minimized demagnetization factor Neff to approach the limit of intrinsic HA. The recent advances in microstructural controling has pushed the coercivity from ~0.2-0.25HA to ~HA/3, which is still far from the theory predicted coercivity in an optimal microstructure ~HA/2.
The magnetic properties of the alloys discussed in this section are listed in Table 10. The composition modification to the original Fe-Nd-B magnet not only changes the intrinsic property of the T1 phase, but also affects the grain bounday phases, which have a big influence on the coercivity. This database can be very useful for exploring the composition modification and process controling parameters for Fe-Nd-B based magnets.
References
[1985Bus] K. H. J. Buschow, D. B. De Mooij, H. M. Van Noort, The Fe-Rich Isothermal Section of Nd-Fe-B at 900oC. Philips J. Res., 40 (1985) 227–238.
[1985Bus2] K. H. J. Buschow, D. B. De Mooij, S. Sinnema, R.J. Radwanski, J.J.M. Franse, Journal of Magnetism and Magnetic Materials, 51 (1985) 211-217.
[1986Ped] A.T. Pedziwiatr and W.E. Wallace, Journal of Less Common Matels, 126 (1986) 41-52.
[1986Ped2] A.T. Pedziwiatr, S.Y. Jiang and W.E. Wallace, Journal of Magnetism and Magnetic Materials, 62 (1986) 29-35.
[1987Bol] F. Bolzoni, J. M. D. Coey, J. P. Gavigan, D. Givord, O. Moze, L. Pareti and T. Viadieu, Journal of Magnetism and Magnetic Materials, 65 (1987) 123-127.
[1987Hir] S. Hirosawa, Y. Yamaguchi, K. Tokuhara, H. Yamamoto, S. Fujimura and M. Sagawa, Magnetic properties of Nd2(Fe1-xMx)14B measured on single crystals (M =Al, Cr, Mn and Co), IEEE Transactions on Magnetics, 23 (1987) 2120-2122
[1987Par] L. Pareti, F. Bolzoni, M. Solzi, K.H.J. Buschow, Journal of Less Common Matels, 132 (1987) L5-L8.
[1987Ped] A.T. Pedziwiatr and W.E. Wallace, Journal of Magnetism and Magnetic Materials, 65 (1987) 139-144.
[1987Ped2] A.T. Pedziwiatr and W.E. Wallace, Journal of Magnetism and Magnetic Materials, 66 (1987) 63-68.
[1987Pou] F. Pourarian, S.G. Sankar, E.B. Boltich & W.E. Wallace, Magnetic Anisotropy and Spin Reorientation in Nd2-xPrxCo14B. MRS Online Proceedings Library, 96 (1987) 103.
[1987Sag] M. Sagawa, S. Hirosawa, H. Yamamoto, S. Fujimura and Y. Matsuura, Japanese Journal of Applied Physics, 26 (1987) 785-800.
[1988Jia] S.Y. Jiang, Faiz Pourarian, J.X. Yan, W.E. Wallace, Journal of Magnetism and Magnetic Materials, 74 (1988) 181-185.
[1988Jur] M. Jurczyk, Journal of Magnetism and Magnetic Materials, 73 (1988) 199-204.
[1988Pou] F. Pourarian, S.G. Sankar, W.E. Wallace, Journal of Magnetism and Magnetic Materials, 74 (1988) 177-180.
[1988Str] J. Strzeszewski, G.C. Hadjipanayis, and A.S. Kim, The effect of Al substitution on the coercivity of Nd-Fe-B magnets. J. Appl. Phys., 64 (1988) 5568-5570.
[1989Jur] M. Jurczyk, O. Chistjakov, Journal of Magnetism and Magnetic Materials, 78 (1989) 279-282.
[1989Zha] N. Zhang, Y. Luo, Acta Metall Sin, 25 (1989) 121-127.
[1990Jur] M. Jurczyk, Journal of Magnetism and Magnetic Materials, 83 (1990) 237-238.
[1991Lui] F. Luis, B. Mate, C. Pique, et al. A thermodynamic study of the R2Fe14X; X=B,C at the Curie temperature, J Mag Mag Mater., 101 (1991) 414–416.
[2001Den] K.W. Dennis, F.C. Laabs, B.A. Cook, J.L. Harringa, A.M. Russell, R.W. McCallum, Journal of Magnetism and Magnetic Materials, 231 (2001) L33–L37.
[2016Sas] T.T. Sasaki, T. Ohkubo, and K. Hono, Structure and chemical compositions of the grain boundary phase in Nd-Fe-B sintered magnets. Acta Materialia, 115 (2016) 269-27.
[2016Sas2] T.T. Sasaki, T. Ohkubo, Y. Takada, T. Sato, A. Kato, Y. Kaneko, K. Hono, Formation of non-ferromagnetic grain boundary phase in a Ga-doped Nd-rich Nd-Fe-B sintered magnet. Scripta Materialia, 113 (2016) 218-221.
[2017Hir] S. Hirosawa, M. Nishino and S. Miyashita, Adv. Nat. Sci.: Nanosci. Nanotechnol. 8 (2017) 013002.
[2018Tsu] Tsuji, N., et al., Temperature dependence of the crystal structures and phase fractions of secondary phases in a Nd-Fe-B sintered magnet. Acta Materialia, 154 (2018) 25-32.
[2018Xu] X.D. Xu, T.T. Sasaki, J.N. Li, Z.J. Dong, H. Sepehri-Amin, T.H. Kim, T. Ohkubo, T. Schrerfl, K. Hono, Microstructure of a Dy-free Nd-Fe-B sintered magnet with 2 T coercivity. Acta Materialia, 156 (2018) 146-157.
[2021Abe] T. Abe, M. Morishita, Y. Chen, et al., Science and Technology of Advanced Materials, 22 (2021) 557-570.
[2021Li] J. Li, H. Sepehri-Amin, T. Sasaki, T. Ohkubo and K. Hono, Science and Technology of Advanced Materials, 22 (2021) 386-403.
[2021Liu] Z. Liu, J. He, R. Ramanujan, Materials & Design, 209 (2021) 110004.